

Samsung partners with Solana to integrate stablecoins into US Galaxy devices

Source Fxstreet
  • Samsung and Solana announced a partnership on Wednesday to integrate the USDC stablecoin into 82 million US Galaxy devices.
  • Samsung Wallet will support USDC payments and transfers by the end of October, offering cross-border remittances to over 60 countries.
  • Solana maintains a near-term corrective tone on Thursday, holding above $100 after a 3% decline the previous day.

Samsung announced a partnership with Solana (SOL) to integrate the US Dollar stablecoin issued by Circle, USDC, into US Galaxy devices, supporting cross-border remittances. The feature will be built into the Samsung Pay and Samsung Wallet apps, sharing the same screen used for displaying credit cards and boarding passes.

The feature will allow users to transfer USDC across 60 countries by the last week of October. Solana’s network infrastructure will settle payments in the background across the initial batch of 82 million Galaxy devices in the US.

“Stablecoins have the potential to make moving money around the world faster and easier, and we want Galaxy users to be able to take advantage of that without having to navigate the complexity of traditional crypto tools. Solana helps us bring that experience to Samsung's scale,” said Woncheol Chai, EVP and Head of the Digital Wallet Team at the Mobile eXperience (MX) Business at Samsung Electronics. 

Solana has seen stablecoin activity grow sharply over the past year, with supply at $16.61 billion, up from $14.13 billion on January 1. At the same time, the network has processed more than $5.25 trillion in stablecoin volume so far this year.
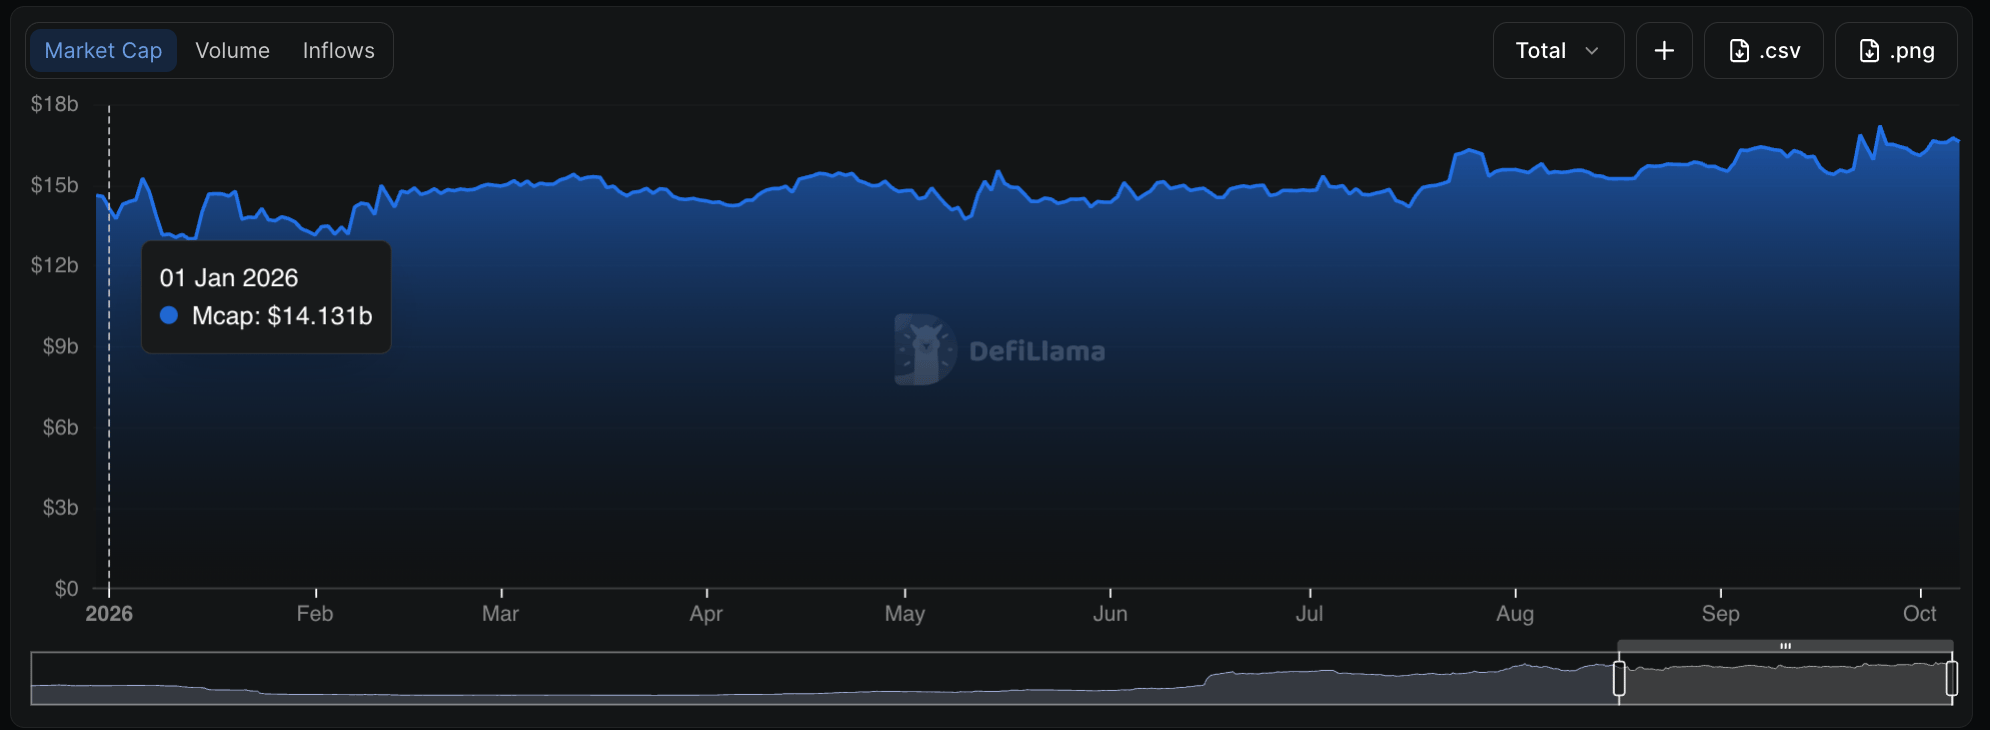
Solana Stablecoin market cap. Source: DeFiLlama

Technical outlook: Solana continues to pose downside risk

Despite the major integration announcement, Solana continues to face near-term selling pressure. At the time of writing, SOL steadies around $116 on Thursday, following a 3% decline the previous day.

Still, the altcoin maintains a long-term constructive bias, with the price well above the 50-, 100-, and 200-day Exponential Moving Averages (EMAs) reinforcing a broader uptrend. The 50-day EMA at $107.47 serves as the immediate support, ahead of secondary demand around the 100-day EMA at $98.49 and the 200-day EMA at $96.78, where buyers would be expected to re-emerge should the token extend a corrective pullback.

However, the Moving Average Convergence Divergence (MACD) slips below its signal line, resulting in a negative histogram reading, hinting that upside momentum is fading. At the same time, the Relative Strength Index (RSI) dips to 54, reaffirming the loss of bullish pressure.

Chart Analysis SOL/USDT (Binance)
SOL/USDT daily price chart.

Looking up, the next notable resistance is the previously defined horizontal barrier at the September 25 high of $122.94, followed by the January 13 high at $148.74 as a distant cap for any extended recovery.

(The technical analysis of this story was written with the help of an AI tool. Know more.)

Disclaimer: For information purposes only. Past performance is not indicative of future results.
placeholder
XRP Price Prediction for July 2026: Can Buyers Finally Break the Downtrend?XRP (XRP) price trades near $1.05, caught between a year-long downtrend and a sudden burst of buying.July has historically rewarded XRP holders. This year the month arrives with on-chain accumulation
Author  Beincrypto
Jun 30, Tue
XRP (XRP) price trades near $1.05, caught between a year-long downtrend and a sudden burst of buying.July has historically rewarded XRP holders. This year the month arrives with on-chain accumulation
placeholder
NVIDIA Price Forecast: Michael Burry Shorts NVDA, but Analysts See $299On July 1, NVIDIA (NASDAQ: NVDA) sits at $198.34, failing to break above the former support level that is now serving as resistance between $198 and $205 on the 2H chart's downward blue c
Author  TradingKey
Jul 02, Thu
On July 1, NVIDIA (NASDAQ: NVDA) sits at $198.34, failing to break above the former support level that is now serving as resistance between $198 and $205 on the 2H chart's downward blue c
placeholder
XAUUSD Gold Analysis: Gold Holds Above $4,350 Ahead of US Inflation Data Is $4,500 Next? Gold holds above $4,350 following weak US jobs data. As inflation reports approach and UBS eyes $5,000, can XAUUSD break resistance at $4,435 to rally toward $4,500?
Author  Naoufal Seddik
Aug 12, Wed
Gold holds above $4,350 following weak US jobs data. As inflation reports approach and UBS eyes $5,000, can XAUUSD break resistance at $4,435 to rally toward $4,500?
placeholder
Gold Price Analysis Today: Gold Drops 1.32% Despite Lower Fed Rate-Hike Bets, Can $4,313 Support Hold? Gold fell 1.32% on August 13 after rising to $4,449.73, then reversing lower and closing near $4,349.918 below the $4,356.46 support. Softer US inflation data reduced Fed rate hike expectations, but selling pressure still dominated the session. Will $4,313 support hold?
Author  Naoufal Seddik
Aug 14, Fri
Gold fell 1.32% on August 13 after rising to $4,449.73, then reversing lower and closing near $4,349.918 below the $4,356.46 support. Softer US inflation data reduced Fed rate hike expectations, but selling pressure still dominated the session. Will $4,313 support hold?
placeholder
Gold Price Analysis Today: Gold Gains 0.94% as Markets Expect Fed to Hold Rates, Can $4,449 Resistance Break? Gold gained 0.94% on August 17, closing near $4,417.30 as softer US data strengthened expectations for unchanged Fed rates in September. Gold remains bullish, with $4,449.730 resistance and $4,310.650 support in focus.
Author  Naoufal Seddik
Aug 18, Tue
Gold gained 0.94% on August 17, closing near $4,417.30 as softer US data strengthened expectations for unchanged Fed rates in September. Gold remains bullish, with $4,449.730 resistance and $4,310.650 support in focus.
Related Instrument
goTop
quote