


Ethena Price Forecast: ENA corrects as Ether.Fi launches stablecoin on the protocol
- Ethena pulls back, giving back short-term gains as traders look for liquidity ahead of another recovery attempt.
- Ether.Fi has launched a stablecoin on Ethena’s infrastructure, joining other networks including Sui Network and Jupiter Exchange.
- Ethena faces intensifying headwinds as the RSI trends lower and the MACD flashes a sell signal.
Ethena (ENA) trades near $0.24000 on Tuesday amid growing technical weakness. The Ethereum Layer-2 token has shed some of its recent gains, which peaked at $0.2946 on September 27, reinforcing profit-taking and buyer exhaustion. An extended sell-off would bring ENA to test the psychological support at $0.2000 and key technical levels further down.
Ether.fi taps Ethena for stablecoin launch
Ether.Fi has announced the launch of Ether.Fi USD powered by Ethena Whitelabel, a stablecoin-as-a-service (SaaS) platform. Whitelabel enables exchanges, blockchain networks and other decentralized applications to launch and manage custom-branded stablecoins.
Ethena stated on X that stablecoin deposits across Ether.Fi exceed $300 million. The Whitelabel.fi protocol will now manage these deposits, including minting and redemption. Ether.Fi USD will also delegate critical operations, including reserve management and regulatory compliance.
EtherFi joins a growing number of crypto projects that have launched unique stablecoin solutions leveraging Ethena’s infrastructure, including Maple Finance, Jupiter Exchange, MegaETH, Sui Network, and other leading platforms.
Ethena attracts steady retail demand
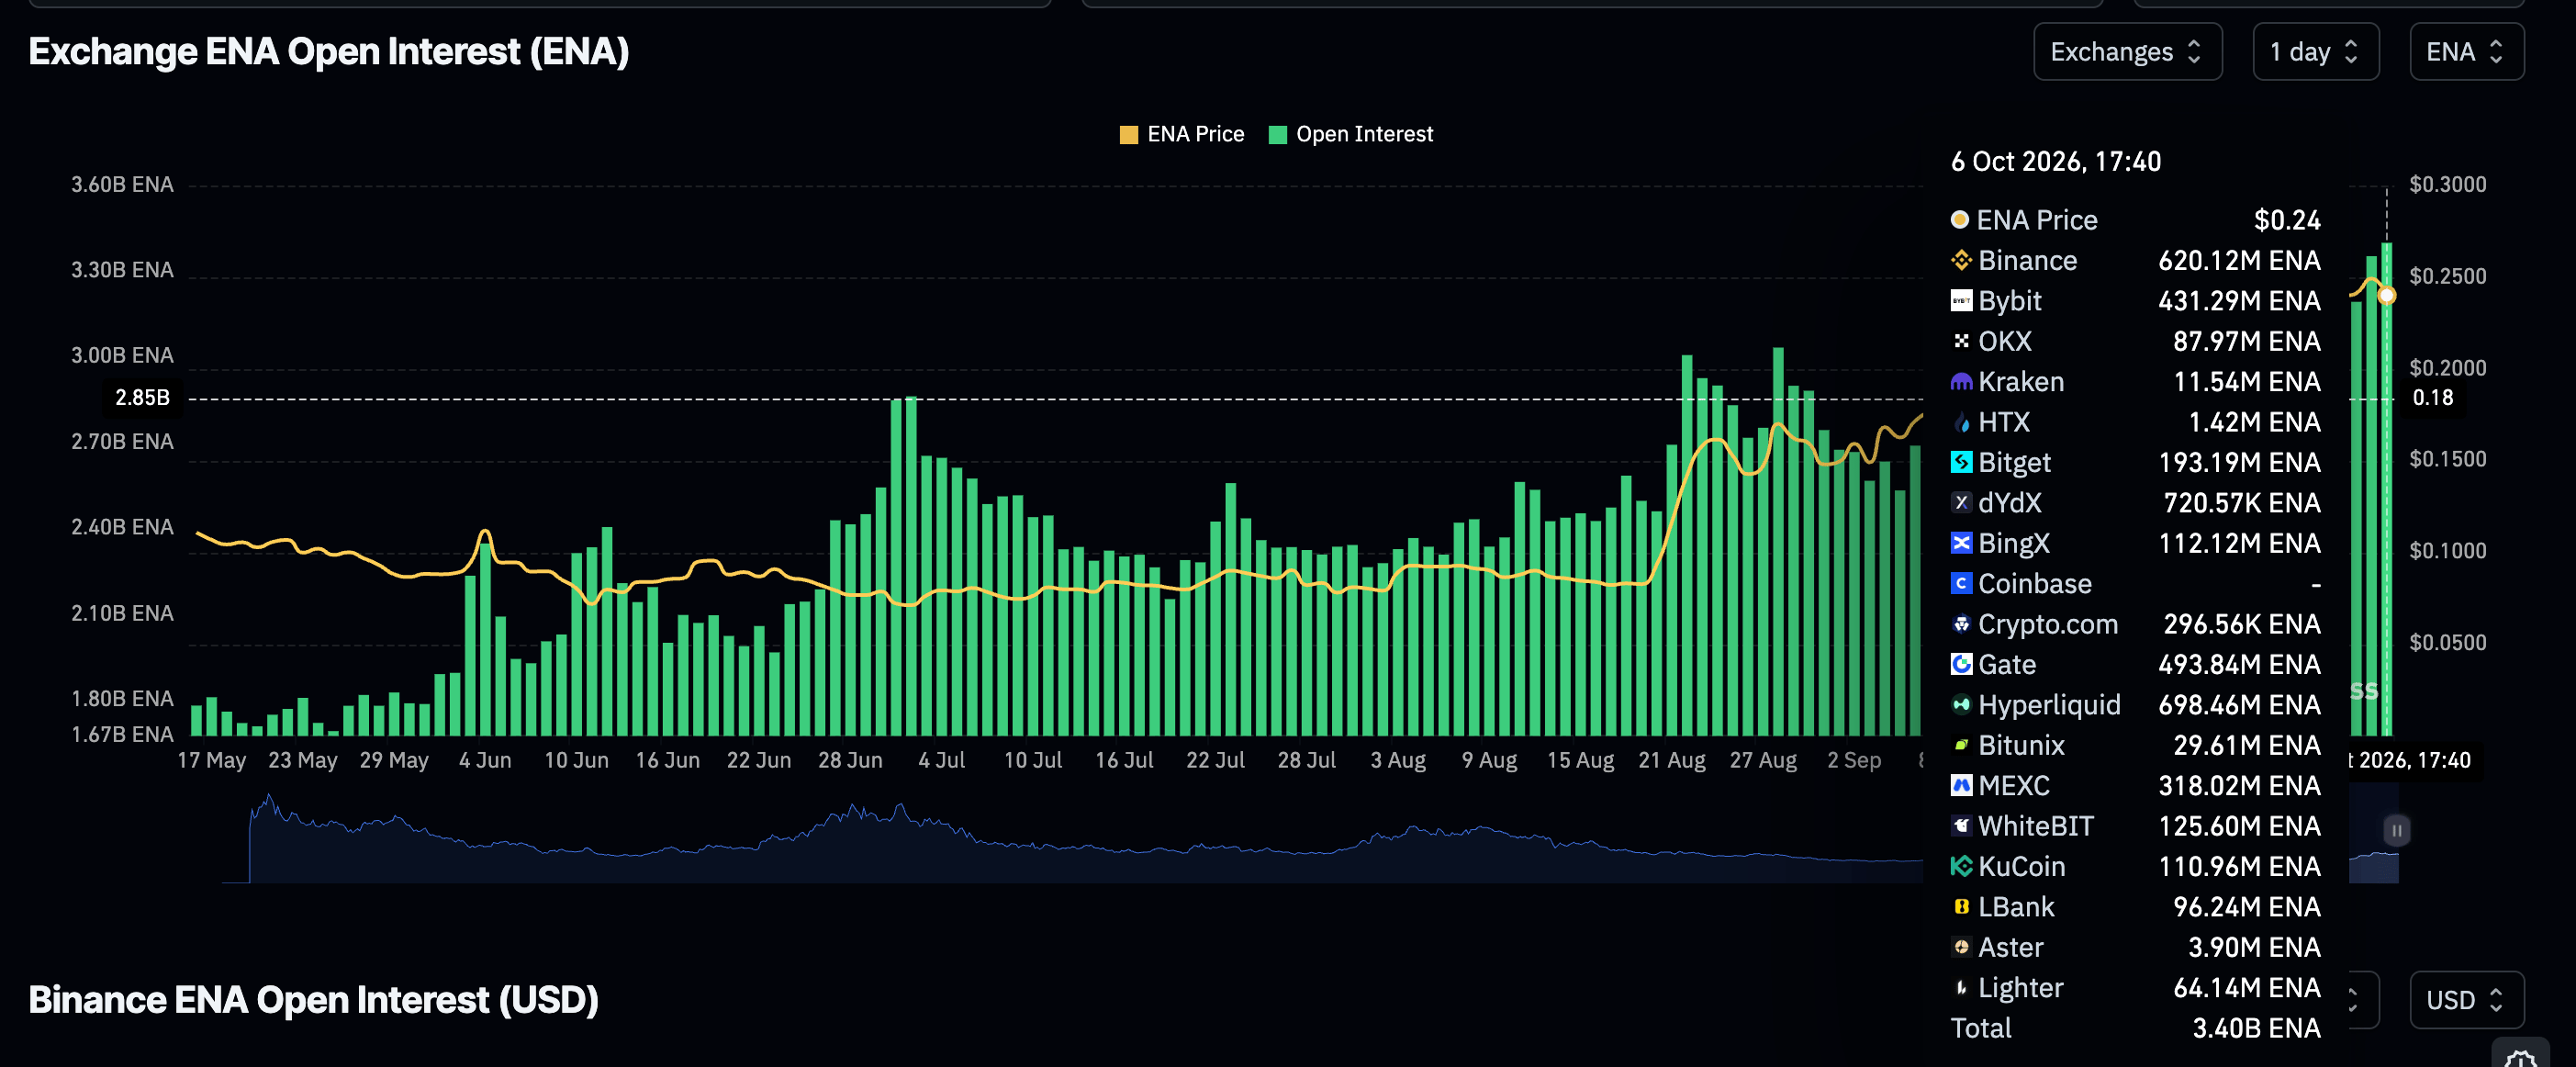
Ethena derivatives retain a firm bullish outlook, with perpetual futures Open Interest (OI) rising to 3.4 billion ENA on Tuesday, from 3.2 billion ENA the day before. Broadly, OI has risen more than 32% from mid-September levels of around 2.3 billion ENA. Meanwhile, trading volume has crossed above the $1 billion mark, aligning with rising OI and raising the odds of a fresh bullish campaign.
Still, investors should temper expectations as long as ENA remains below the critical $0.3000 psychological supply area. Conversely, declines could be treated as temporary rather than a full-fledged trend reversal if the token holds above support at $0.2000.
Technical Analysis: Ethena seeks liquidity at higher support levels
Ethena trades at $0.2399 as it extends its down leg from the daily high of $0.2531. Despite the correction, ENA maintains a bullish near-term bias as price holds well above the 50-day, 100-day and 200-day Exponential Moving Averages (EMAs).
The pair has extended its recovery from the mid-$0.1400s, though the Parabolic SAR at $0.2894 overhead suggests upside is becoming more measured. The Relative Strength Index (RSI) at 58 keeps directional pressure constructive but not overbought, while the Moving Average Convergence Divergence (MACD) sits below zero with a negative reading, hinting that the latest advance is losing some momentum even as the broader structure stays supportive.
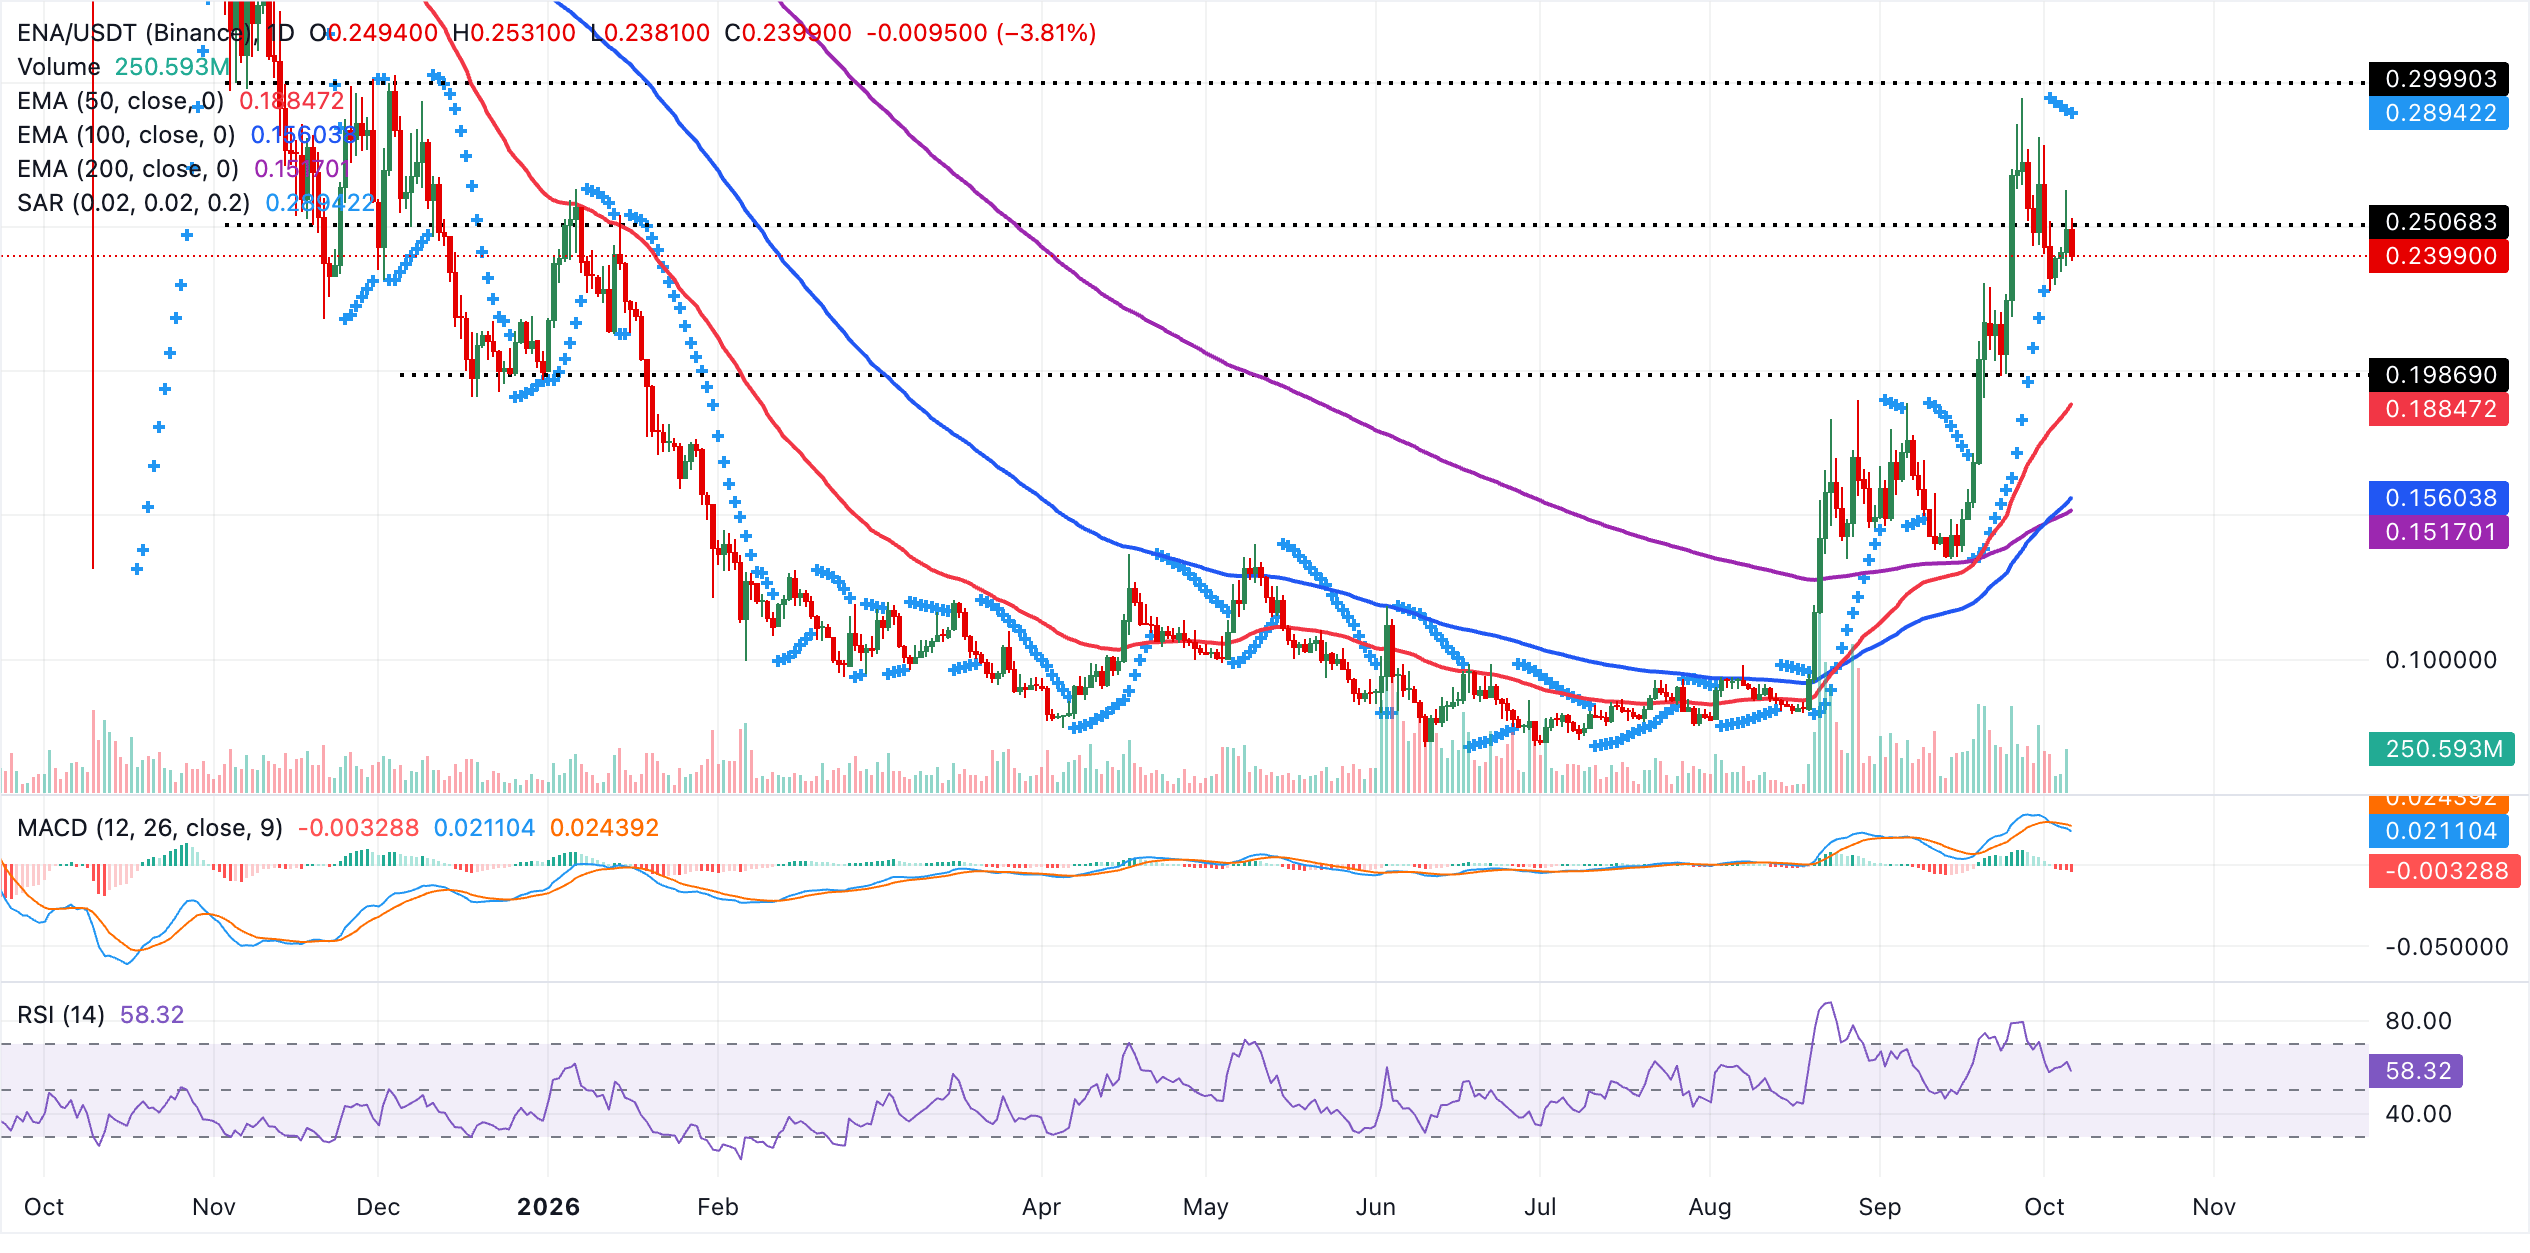
Immediate support lies around the current $0.2399 area, where the latest daily close and open align as a short-term pivot, followed by the 50-day EMA at $0.1885, which reinforces the broader rising trend. Deeper pullbacks would likely look toward the 100-day and 200-day EMAs at $0.1560 and $0.1517 as more strategic demand zones.
On the topside, the Parabolic SAR at $0.2894 marks the next key resistance, and a sustained break above this level would open the way for a continuation of the medium-term uptrend, whereas failure to clear it could trigger consolidation or a corrective phase back toward the underlying EMA supports.
(The technical analysis of this story was written with the help of an AI tool. Know more.)
Open Interest, funding rate FAQs
Higher Open Interest is associated with higher liquidity and new capital inflow to the market. This is considered the equivalent of increase in efficiency and the ongoing trend continues. When Open Interest decreases, it is considered a sign of liquidation in the market, investors are leaving and the overall demand for an asset is on a decline, fueling a bearish sentiment among investors.
Funding fees bridge the difference between spot prices and prices of futures contracts of an asset by increasing liquidation risks faced by traders. A consistently high and positive funding rate implies there is a bullish sentiment among market participants and there is an expectation of a price hike. A consistently negative funding rate for an asset implies a bearish sentiment, indicating that traders expect the cryptocurrency’s price to fall and a bearish trend reversal is likely to occur.
Recommended Articles


