

Dogecoin Price Forecast: ETF inflows and technicals fuel recovery

Source Fxstreet
  • Dogecoin extends gains on Monday after finding support around the key 200-day EMA.
  • US-listed spot ETFs recorded inflows of $327,360 last week, marking the third consecutive week of inflows.
  • Strengthening derivatives metrics and a constructive technical outlook support further gains for DOGE.

Dogecoin (DOGE) extends its gains, trading above $0.096 on Monday after finding support around the key support zone last week. Continued inflows into spot DOGE Exchange Traded Funds (ETFs), alongside strengthening derivatives metrics, indicate improving market sentiment. Meanwhile, the constructive technical outlook suggests the meme coin could extend its gains if the key level holds.

DOGE’s institutional demand remains robust

SoSoValue data showed spot ETFs recorded $327,360 last week, marking the third straight week of inflows and indicating strong institutional demand. If this inflow trend continues, stays positive and intensifies through the week, the dog-themed meme coin could extend gains.
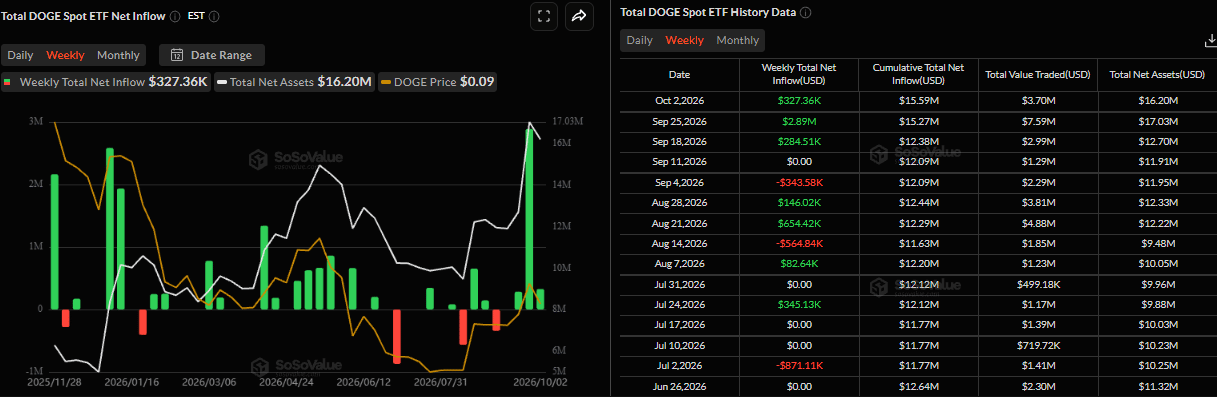
Total DOGE spot ETF net inflow weekly chart. Source: SoSoValue

Improving derivatives positioning among DOGE traders

Derivatives data shows a bullish outlook for DOGE. CoinGlass’ long-to-short ratio for DOGE reads 1.01 on Monday, flipping into green territory. A ratio above one indicates bullish sentiment, as traders bet that asset prices will rise.
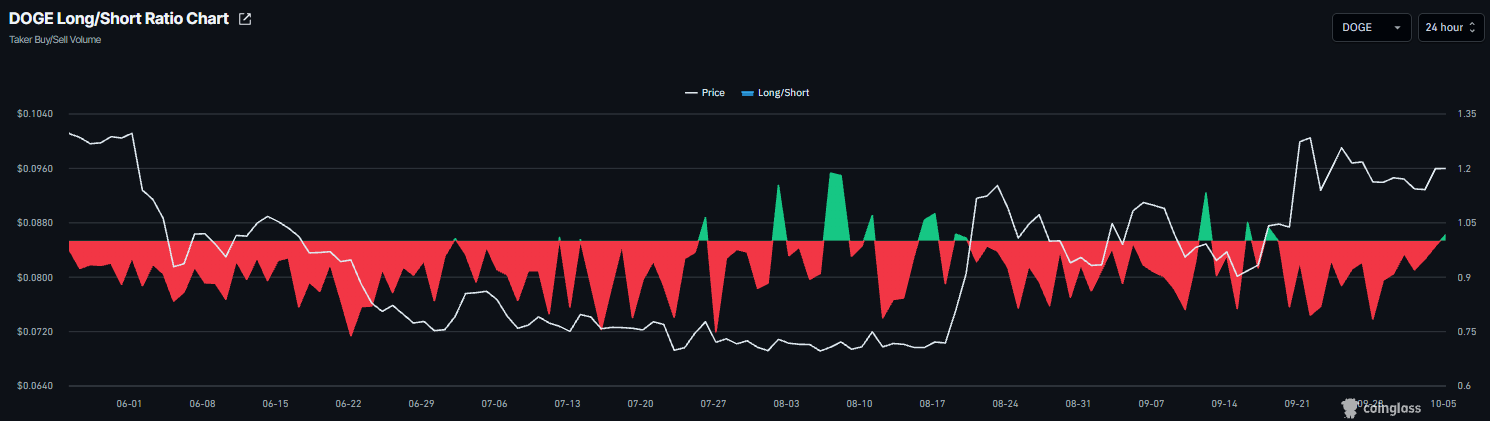
DOGE long-to-short ratio chart. Source: Coinglass

In addition, Dogecoin’s funding rate flipped positive on September 10 and rose to 0.0092% on Monday. This indicates longs are paying shorts, reflecting a bullish outlook for Dogecoin.
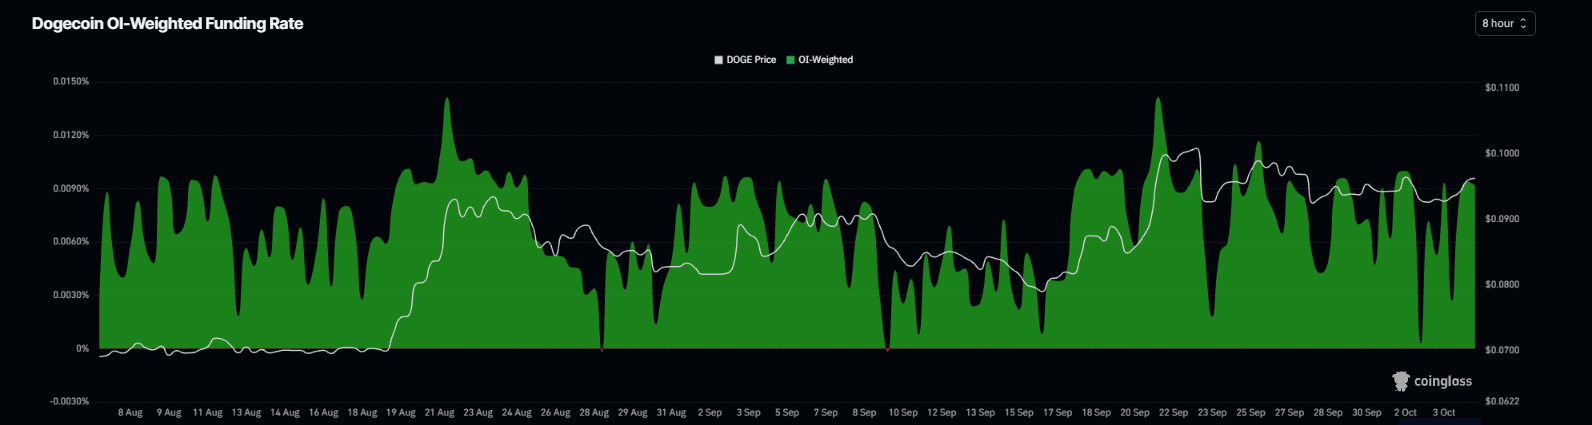
DOGE funding rates chart. Source: Coinglass

Dogecoin technical outlook: 200-day EMA holds strong

Dogecoin price trades around $0.096 on Monday, maintaining a bullish near-term bias as it holds above the 200-day exponential moving average (EMA) at $0.093, with the shorter 50-day and 100-day EMAs clustered between roughly $0.086 and $0.088.

The Relative Strength Index (RSI) near 58 suggests constructive but not overextended momentum. At the same time, the Moving Average Convergence Divergence (MACD) has slipped marginally into negative territory, hinting at a mild loss of upside pressure rather than a decisive trend change.

On the downside, immediate support is at the 200-day EMA near $0.093, with additional demand at the horizontal level of $0.088 and the nearby 50-day EMA at $0.088; deeper support emerges at the 100-day EMA around $0.086, ahead of the more distant structural floors at $0.070.

On the topside, initial resistance is defined by the horizontal barrier at $0.102, and a sustained move above this cap would open the way for a continuation of the broader recovery phase.
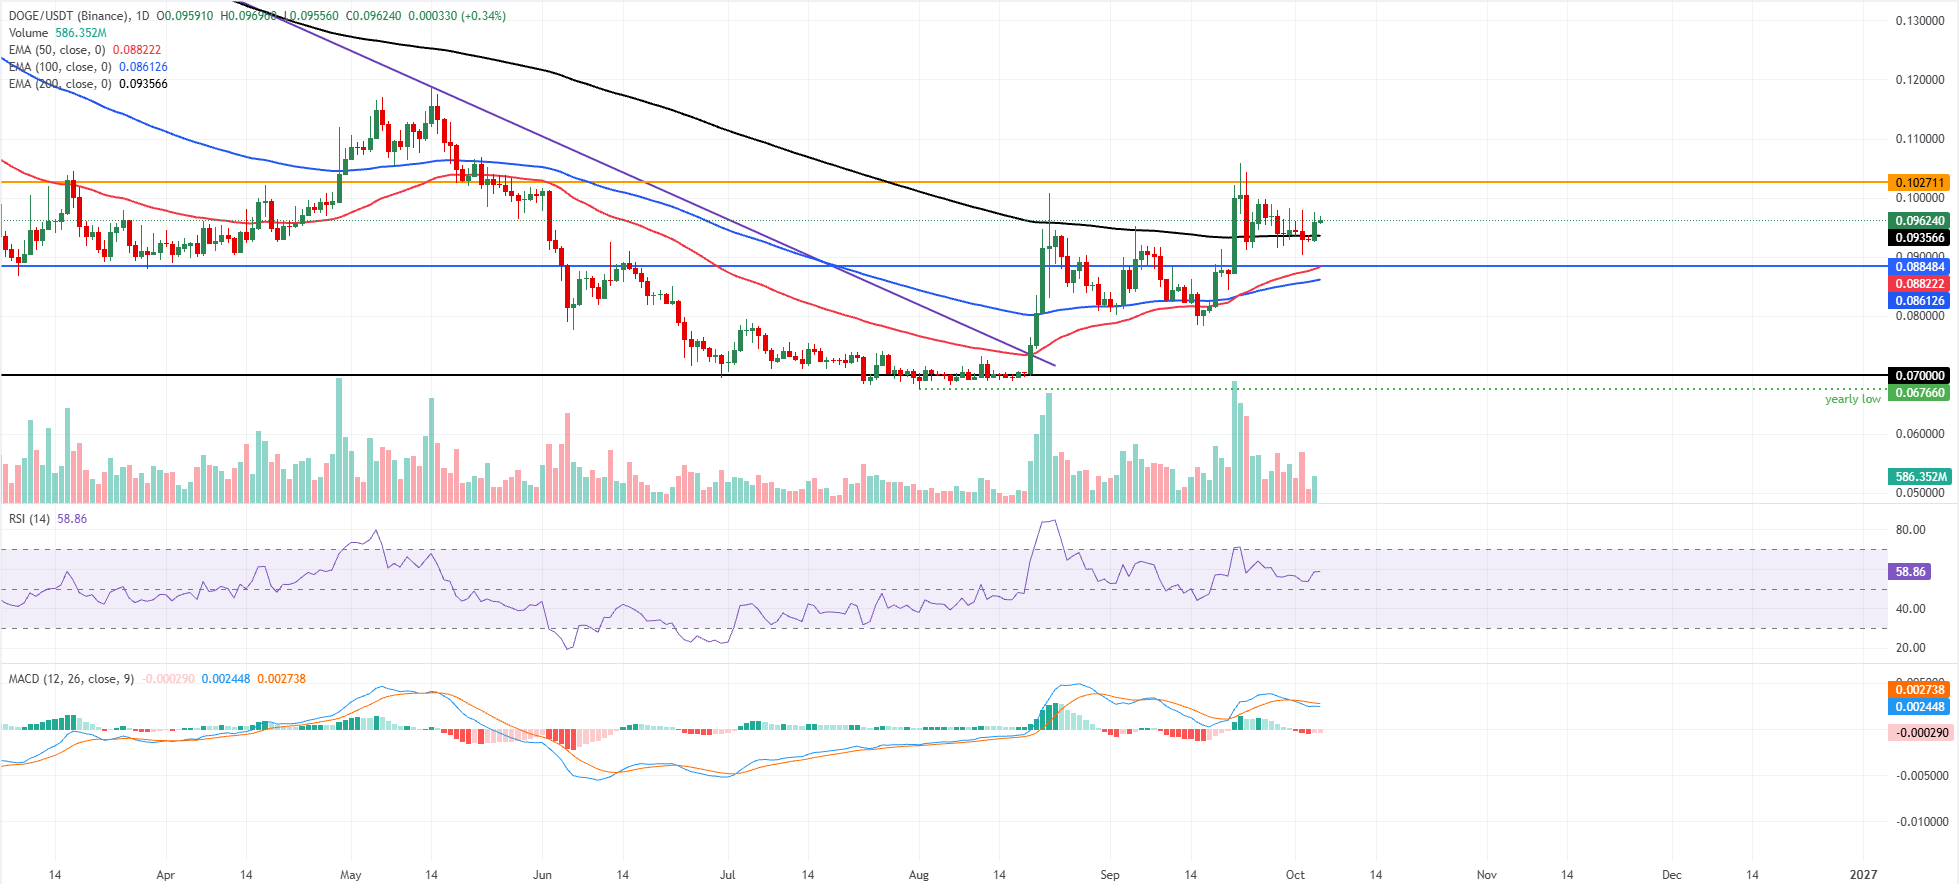
DOGE/USDT daily chart

(The technical analysis of this story was written with the help of an AI tool. Know more.)

Disclaimer: For information purposes only. Past performance is not indicative of future results.
placeholder
OPEC+ Deepens Production Hikes as Hormuz Bottlenecks Stifle Actual SupplyOPEC+ core members will lift July oil quotas by 188,000 barrels per day, but geopolitical shipping constraints and the UAE’s exit keep actual global crude supplies tight.
Author  Mitrade Team
Jun 08, Mon
OPEC+ core members will lift July oil quotas by 188,000 barrels per day, but geopolitical shipping constraints and the UAE’s exit keep actual global crude supplies tight.
placeholder
XRP Price Prediction for July 2026: Can Buyers Finally Break the Downtrend?XRP (XRP) price trades near $1.05, caught between a year-long downtrend and a sudden burst of buying.July has historically rewarded XRP holders. This year the month arrives with on-chain accumulation
Author  Beincrypto
Jun 30, Tue
XRP (XRP) price trades near $1.05, caught between a year-long downtrend and a sudden burst of buying.July has historically rewarded XRP holders. This year the month arrives with on-chain accumulation
placeholder
XAUUSD Gold Analysis: Gold Holds Above $4,350 Ahead of US Inflation Data Is $4,500 Next? Gold holds above $4,350 following weak US jobs data. As inflation reports approach and UBS eyes $5,000, can XAUUSD break resistance at $4,435 to rally toward $4,500?
Author  Naoufal Seddik
Aug 12, Wed
Gold holds above $4,350 following weak US jobs data. As inflation reports approach and UBS eyes $5,000, can XAUUSD break resistance at $4,435 to rally toward $4,500?
placeholder
Gold Price Analysis Today: Gold Drops 1.32% Despite Lower Fed Rate-Hike Bets, Can $4,313 Support Hold? Gold fell 1.32% on August 13 after rising to $4,449.73, then reversing lower and closing near $4,349.918 below the $4,356.46 support. Softer US inflation data reduced Fed rate hike expectations, but selling pressure still dominated the session. Will $4,313 support hold?
Author  Naoufal Seddik
Aug 14, Fri
Gold fell 1.32% on August 13 after rising to $4,449.73, then reversing lower and closing near $4,349.918 below the $4,356.46 support. Softer US inflation data reduced Fed rate hike expectations, but selling pressure still dominated the session. Will $4,313 support hold?
placeholder
Gold Price Analysis Today: Gold Gains 0.94% as Markets Expect Fed to Hold Rates, Can $4,449 Resistance Break? Gold gained 0.94% on August 17, closing near $4,417.30 as softer US data strengthened expectations for unchanged Fed rates in September. Gold remains bullish, with $4,449.730 resistance and $4,310.650 support in focus.
Author  Naoufal Seddik
Aug 18, Tue
Gold gained 0.94% on August 17, closing near $4,417.30 as softer US data strengthened expectations for unchanged Fed rates in September. Gold remains bullish, with $4,449.730 resistance and $4,310.650 support in focus.
Related Instrument
goTop
quote