


Near Protocol slides below $5.00 after Near Intents $4M exploit
- Near Protocol comes under heavy selling pressure, correcting below $5.00 on Thursday.
- Near Intents suspended services after a bug in its deposit and withdrawal infrastructure led to an exploit involving about $4 million.
- The exploit affected deposits and withdrawals across several crypto networks, including Polygon, Stellar and Avalanche.
Near Protocol (NEAR) uptrend has been cut short, as the price slides below $5.00 on Thursday. The correction comes after an exploit on the network’s Near Intents services, which affected deposits and withdrawals across 12 crypto networks.
NEAR is currently trading at $4.88, below the daily high of $5.54, while falling momentum indicators suggest that sellers are gaining the upper hand.
Near Intents announces $4M exploit
Near Intents suspended services on Thursday after a security incident caused by a bug in the interaction between its Omni deposit and withdrawal infrastructure and the protocol’s smart contract. A preliminary report indicated that the exploit resulted in the loss of $3.8 million.
Deposits and withdrawals across 12 crypto networks were affected, including BNB Smart Chain, Polygon, Optimism, Avalanche, Stellar, Plasma and more.
The contract vulnerability has been fixed, and normal operations are expected to resume today. Near Intents said it reported the incident to law enforcement, and all funds will be compensated in full.
Technical analysis: NEAR slides as selling intensifies
NEAR edges lower below $5.00 as sell-side pressure intensifies. Despite the ongoing correction, the token maintains a clear bullish bias as price holds well above the 50-day, 100-day, and 200-day Exponential Moving Averages (EMAs), reinforcing the constructive structure beneath spot.
The Relative Strength Index (RSI) at 66 stays in bullish territory without yet reaching extreme overbought levels. The Moving Average Convergence Divergence (MACD) indicator remains positive, hinting at moderating upside momentum after the recent rally.
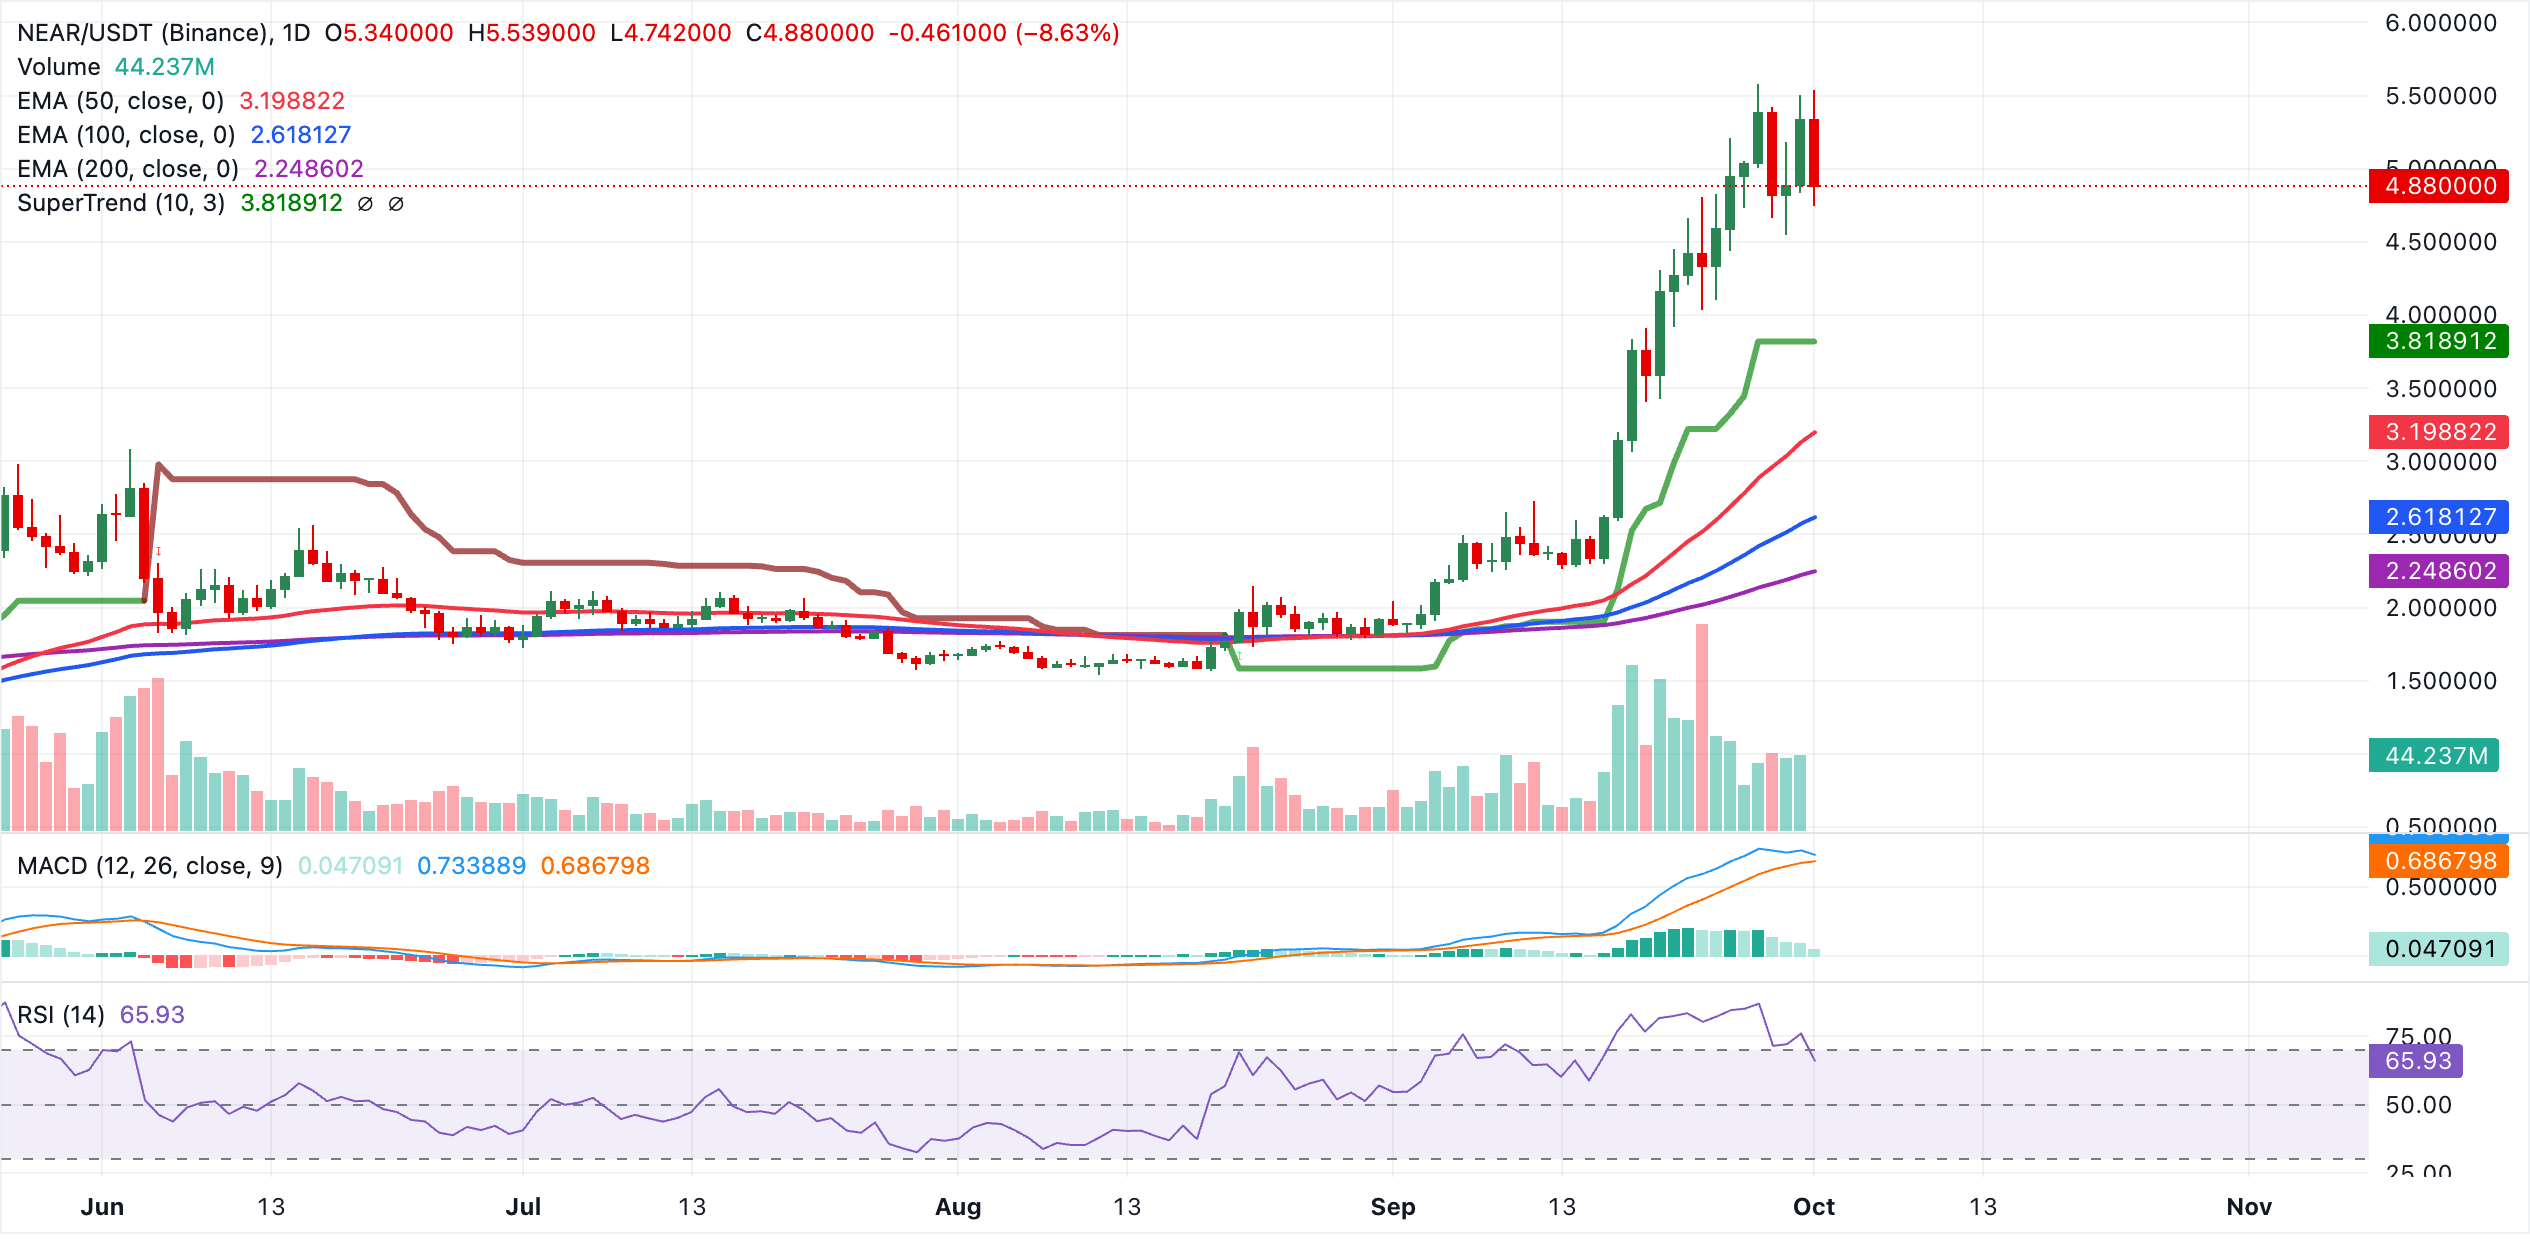
Initial support lies at the SuperTrend level around $3.82, followed by the 50-day EMA near $3.20, with deeper technical floors coming in at the 100-day EMA at $2.62 and the 200-day EMA around $2.25. As long as NEAR holds above these stacked supports, pullbacks are likely to be treated as corrective pauses within the broader uptrend, while fresh topside levels would only start to emerge once price extends decisively beyond the recent highs above $5.00.
(The technical analysis of this story was written with the help of an AI tool. Know more.)
Bitcoin, altcoins, stablecoins FAQs
Bitcoin is the largest cryptocurrency by market capitalization, a virtual currency designed to serve as money. This form of payment cannot be controlled by any one person, group, or entity, which eliminates the need for third-party participation during financial transactions.
Altcoins are any cryptocurrency apart from Bitcoin, but some also regard Ethereum as a non-altcoin because it is from these two cryptocurrencies that forking happens. If this is true, then Litecoin is the first altcoin, forked from the Bitcoin protocol and, therefore, an “improved” version of it.
Stablecoins are cryptocurrencies designed to have a stable price, with their value backed by a reserve of the asset it represents. To achieve this, the value of any one stablecoin is pegged to a commodity or financial instrument, such as the US Dollar (USD), with its supply regulated by an algorithm or demand. The main goal of stablecoins is to provide an on/off-ramp for investors willing to trade and invest in cryptocurrencies. Stablecoins also allow investors to store value since cryptocurrencies, in general, are subject to volatility.
Bitcoin dominance is the ratio of Bitcoin's market capitalization to the total market capitalization of all cryptocurrencies combined. It provides a clear picture of Bitcoin’s interest among investors. A high BTC dominance typically happens before and during a bull run, in which investors resort to investing in relatively stable and high market capitalization cryptocurrency like Bitcoin. A drop in BTC dominance usually means that investors are moving their capital and/or profits to altcoins in a quest for higher returns, which usually triggers an explosion of altcoin rallies.
Recommended Articles


