


Why Bitcoin has failed to clear $85,000 — Profit-taking and weak ETF demand weigh on price
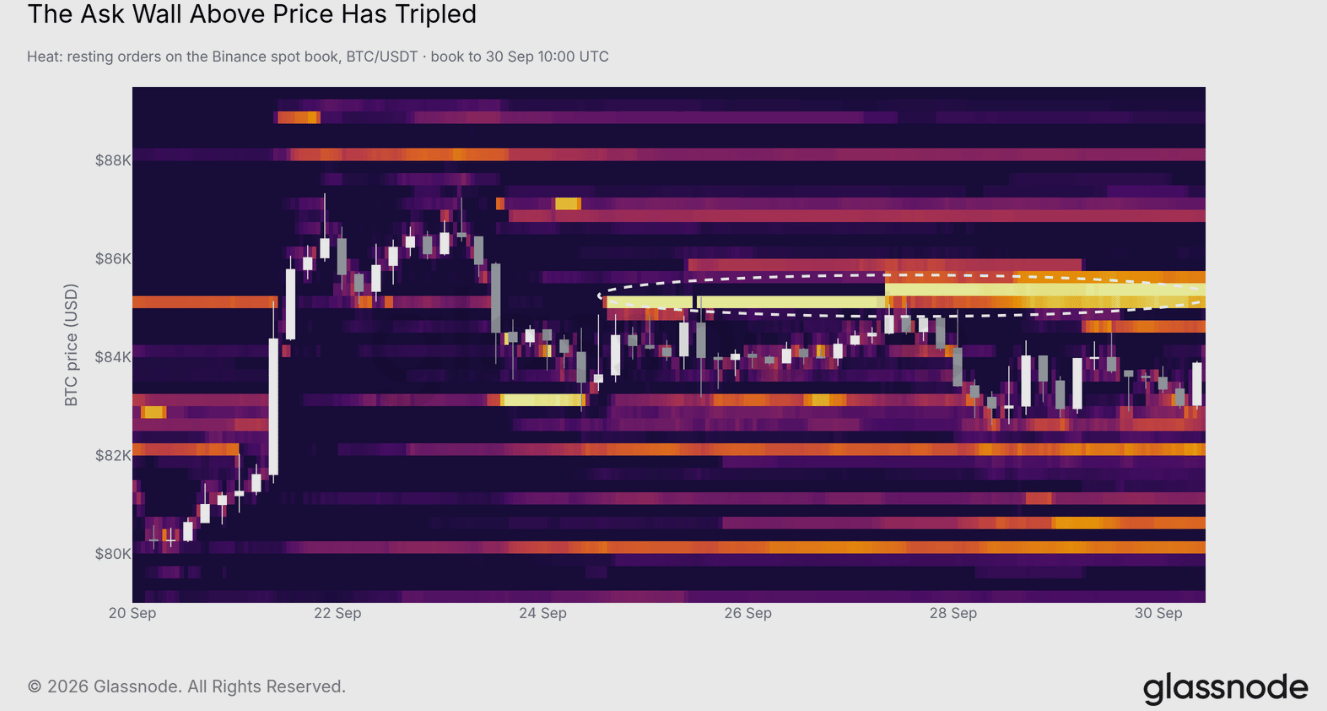
- Bitcoin faces resistance from a growing 85K-85.5K sell wall on Binance, with resting orders tripling since September 24.
- The top crypto remains above its True Market Mean at $77,200, roughly 8% below the market price.
- Long-term holders’ share of realized Bitcoin profits rose from 34% to 55% during the week ending September 29, signaling increased profit-taking.
Bitcoin (BTC) is holding above key support levels, but a growing concentration of sell orders between $85,000 and $85,500 on Binance is preventing the top crypto from extending its recent advance, according to on-chain analytics firm Glassnode.
Bitcoin holds steady despite rising resistance near $85K
In a report on Wednesday, Glassnode noted that the resistance wall on Binance’s spot order book emerged on September 24 and has since tripled in size. Bitcoin has moved into the lower half of the zone but has failed to break through it, leaving the area as the most significant near-term resistance identified by Glassnode.
“As long as those orders stay in place, the wall is the level that matters most. A sustained break above $85.5K would clear the largest resistance on the book,” Glassnode wrote.
While resistance has strengthened, Bitcoin’s Short-Term Holder (STH) Cost Basis, which stands at $73,300, signals that buyers are in profit.
Glassnode noted that Bitcoin spent months above the metric during the 2023 and 2024 uptrends. A decline below $73,300 would, therefore, put recent buyers back in losses, as was the case for much of H1.
Bitcoin has also remained above its True Market Mean since September 18. The metric currently stands at $77,200, around 8% below the market price.
“The True Market Mean is the first support to watch: a daily close back below $77.2K would end the current stretch,” Glassnode stated.
Bitcoin ETF inflows fade after early September surge
However, the market still lacks strong trading activity. Combined Bitcoin volume across spot exchanges and US spot BTC exchange-traded funds (ETFs) is averaging about $6.4 billion per day, close to the bottom of its range since the launch of the ETFs.
“With so little volume behind it, the rally remains early and speculative and broad demand has yet to arrive,” Glassnode stated.
The firm suggested that a sustained increase in volume while Bitcoin remains above the True Market Mean would provide evidence that the uptrend is gaining wider support.
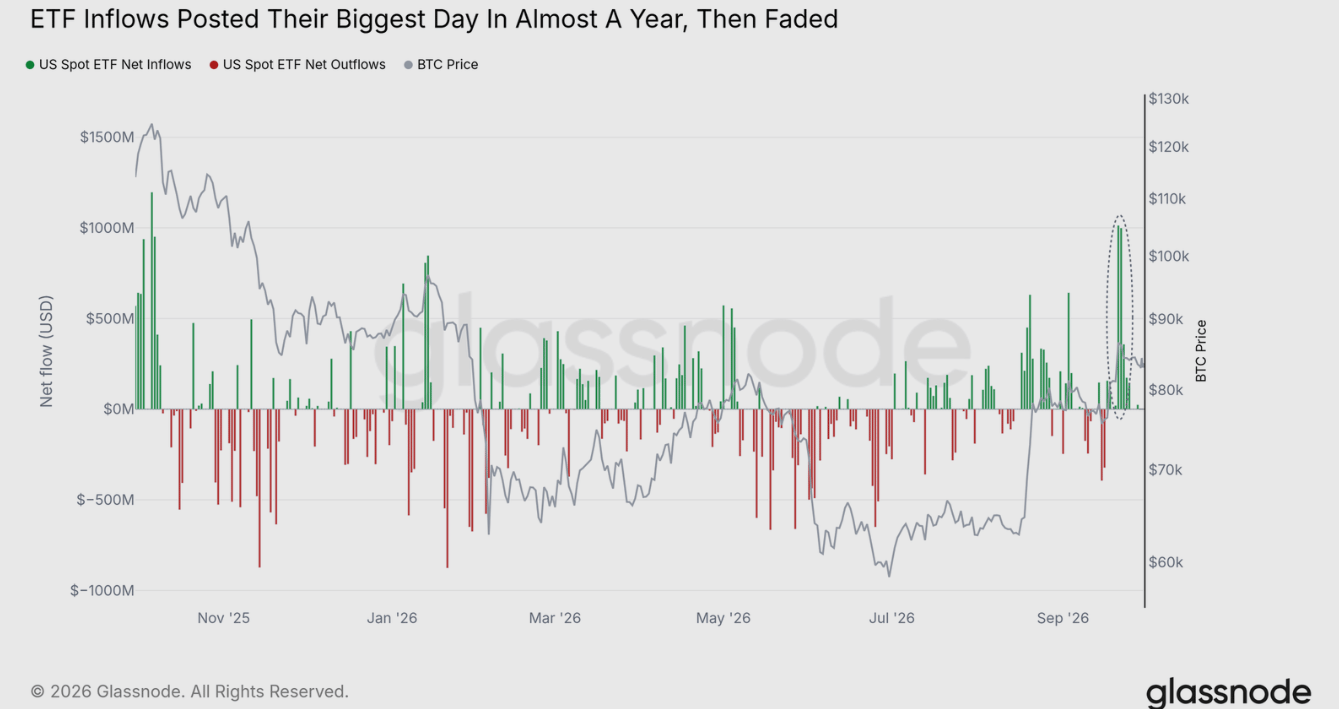
ETF demand has also weakened after buying surged earlier in the month. US spot Bitcoin ETF net inflows reached approximately $1 billion on both September 21 and September 22, with the first day marking the largest inflow in almost a year. Since then, inflows have declined on every trading day, falling to $24 million on Monday.
“The funds are still buying, but at a small fraction of the pace of those two days,” the report noted.
On the other hand, profit-taking remains comparatively subdued. Weekly Net Realized Profit/Loss is still well below the levels recorded around the 2024 and 2025 market tops.
However, long-term holders (LTHs) are accounting for a growing share of realized profits. Their realized profit level nearly doubled in the 7 days ending September 29 compared with the breakout week, while their share of total realized profit increased from 34% to 55%.
Bitcoin has also maintained a short-term advantage over the S&P 500, although the gap has narrowed. Over the past week, BTC fell 2.9%, compared with a 1.2% decline for the index.
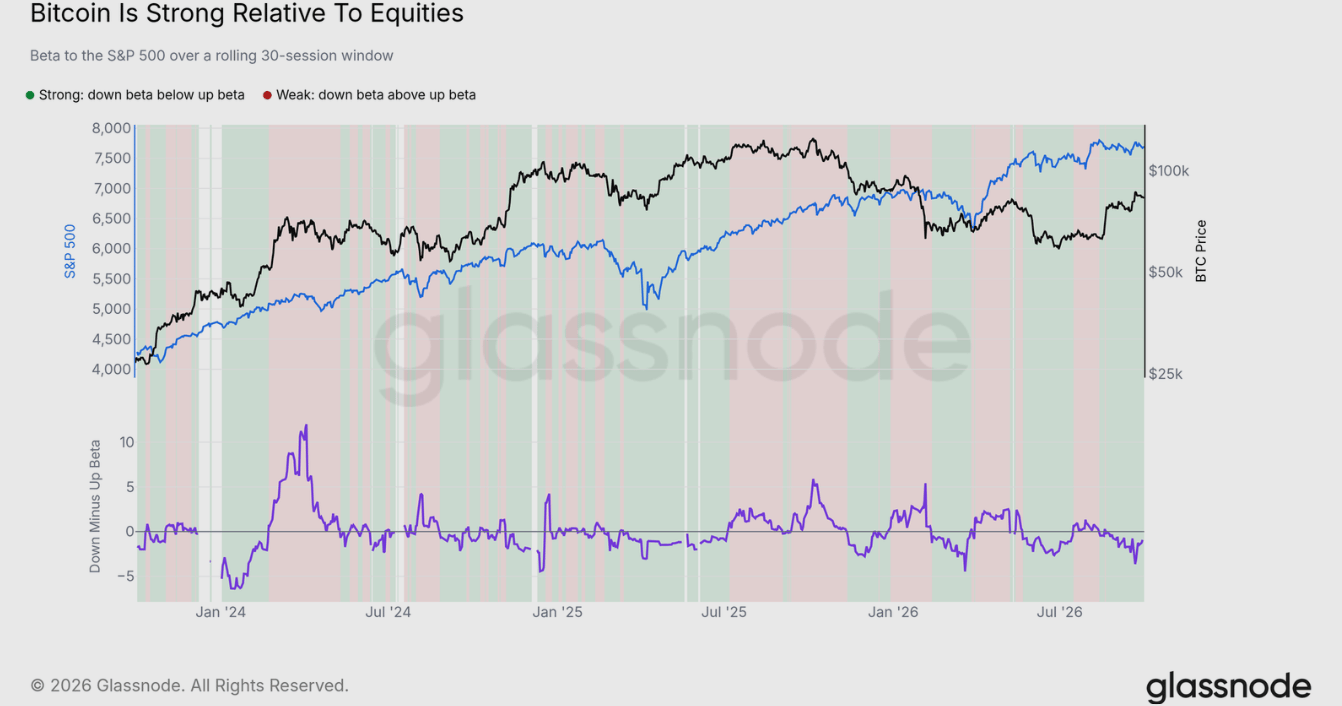
“If the green stretch turns red as August's sessions leave the window, the edge over stocks would be gone,” Glassnode added.
Bitcoin is trading at $83,600, down 0.1% over the past 24 hours at the time of writing.
Recommended Articles


