

Pi Network Price Forecast: PI tests 50-day EMA breakout as market hype builds

Source Fxstreet
  • Pi Network ticks higher on Wednesday, hovering above $0.0910 after a bullish close the previous day.
  • A steady increase in PI futures Open Interest points to firm derivatives demand as the broader cryptocurrency market maintains a risk-on sentiment.
  • The technical outlook for PI shows a near-term upside bias, with bulls testing the 50-day EMA breakout.

Pi Network (PI) edges above $0.0910 at press time on Wednesday, advancing the mild recovery from the previous day. The PI futures Open Interest shows a positional buildup, possibly supporting a rebound amid broader market risk-on sentiment. The technical outlook for PI indicates a mild bullish bias as the near-term recovery tests the 50-day Exponential Moving Average (EMA) breakout at $0.0917.

Retail speculations hold firm amid broader market risk-on sentiment

Pi Network builds retail strength as investors' risk appetite remains elevated. CoinAnk data shows the PI futures Open Interest (OI) stands at $10.57 million on Wednesday, up from $10.05 million the previous day, suggesting an increase in the notional value of all active contracts. 
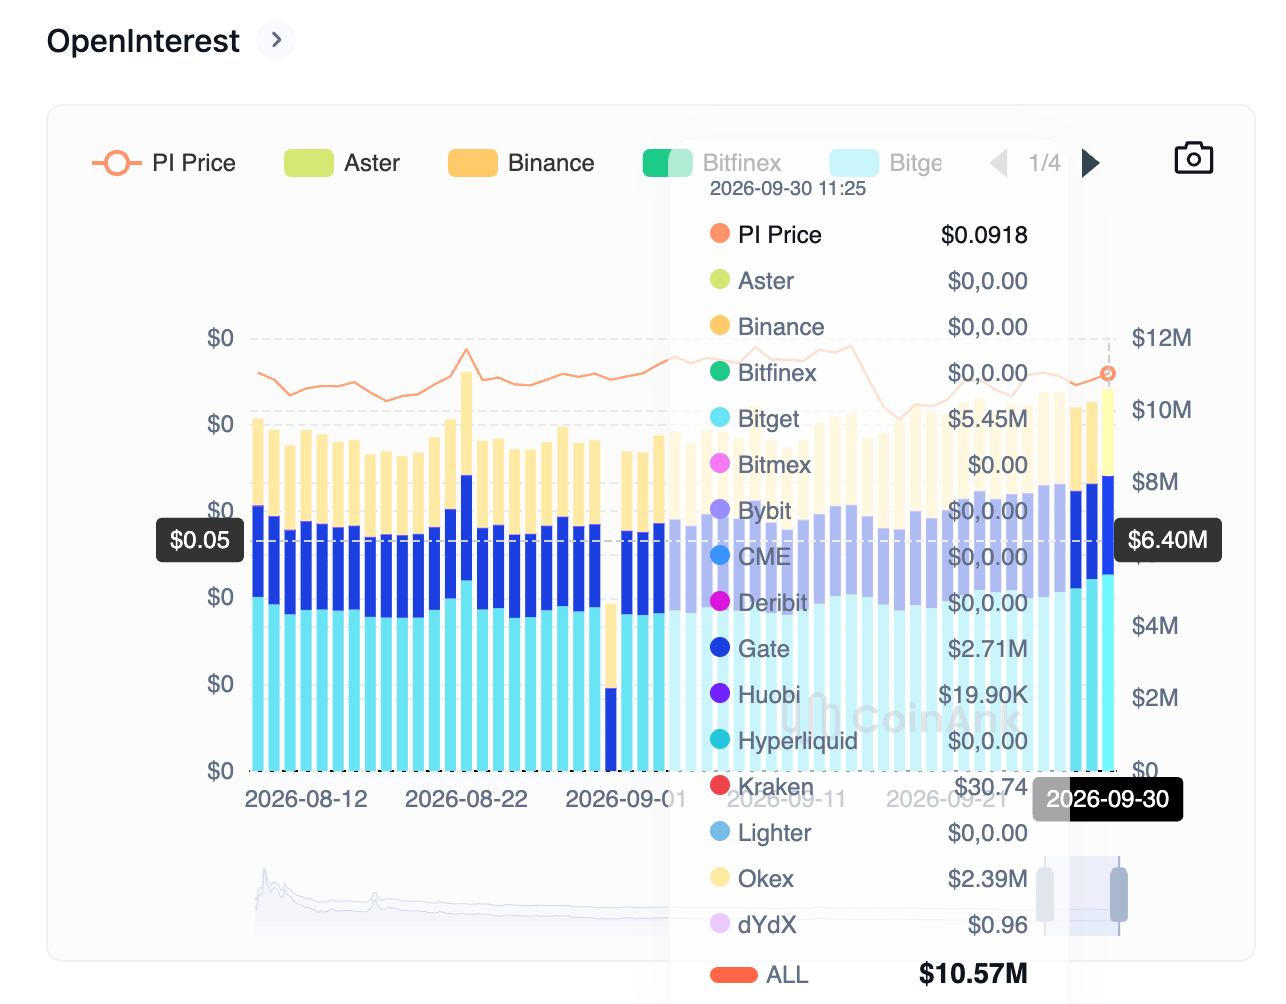
PI token Open Interest chart. Source: CoinAnk

At the same time, CoinMarketCap’s Fear and Greed Index stands at 67, continuing its decline from 74 last week. Still, the indicators suggest elevated risk appetite as it rests well above the upper band of the neutral range at 60.
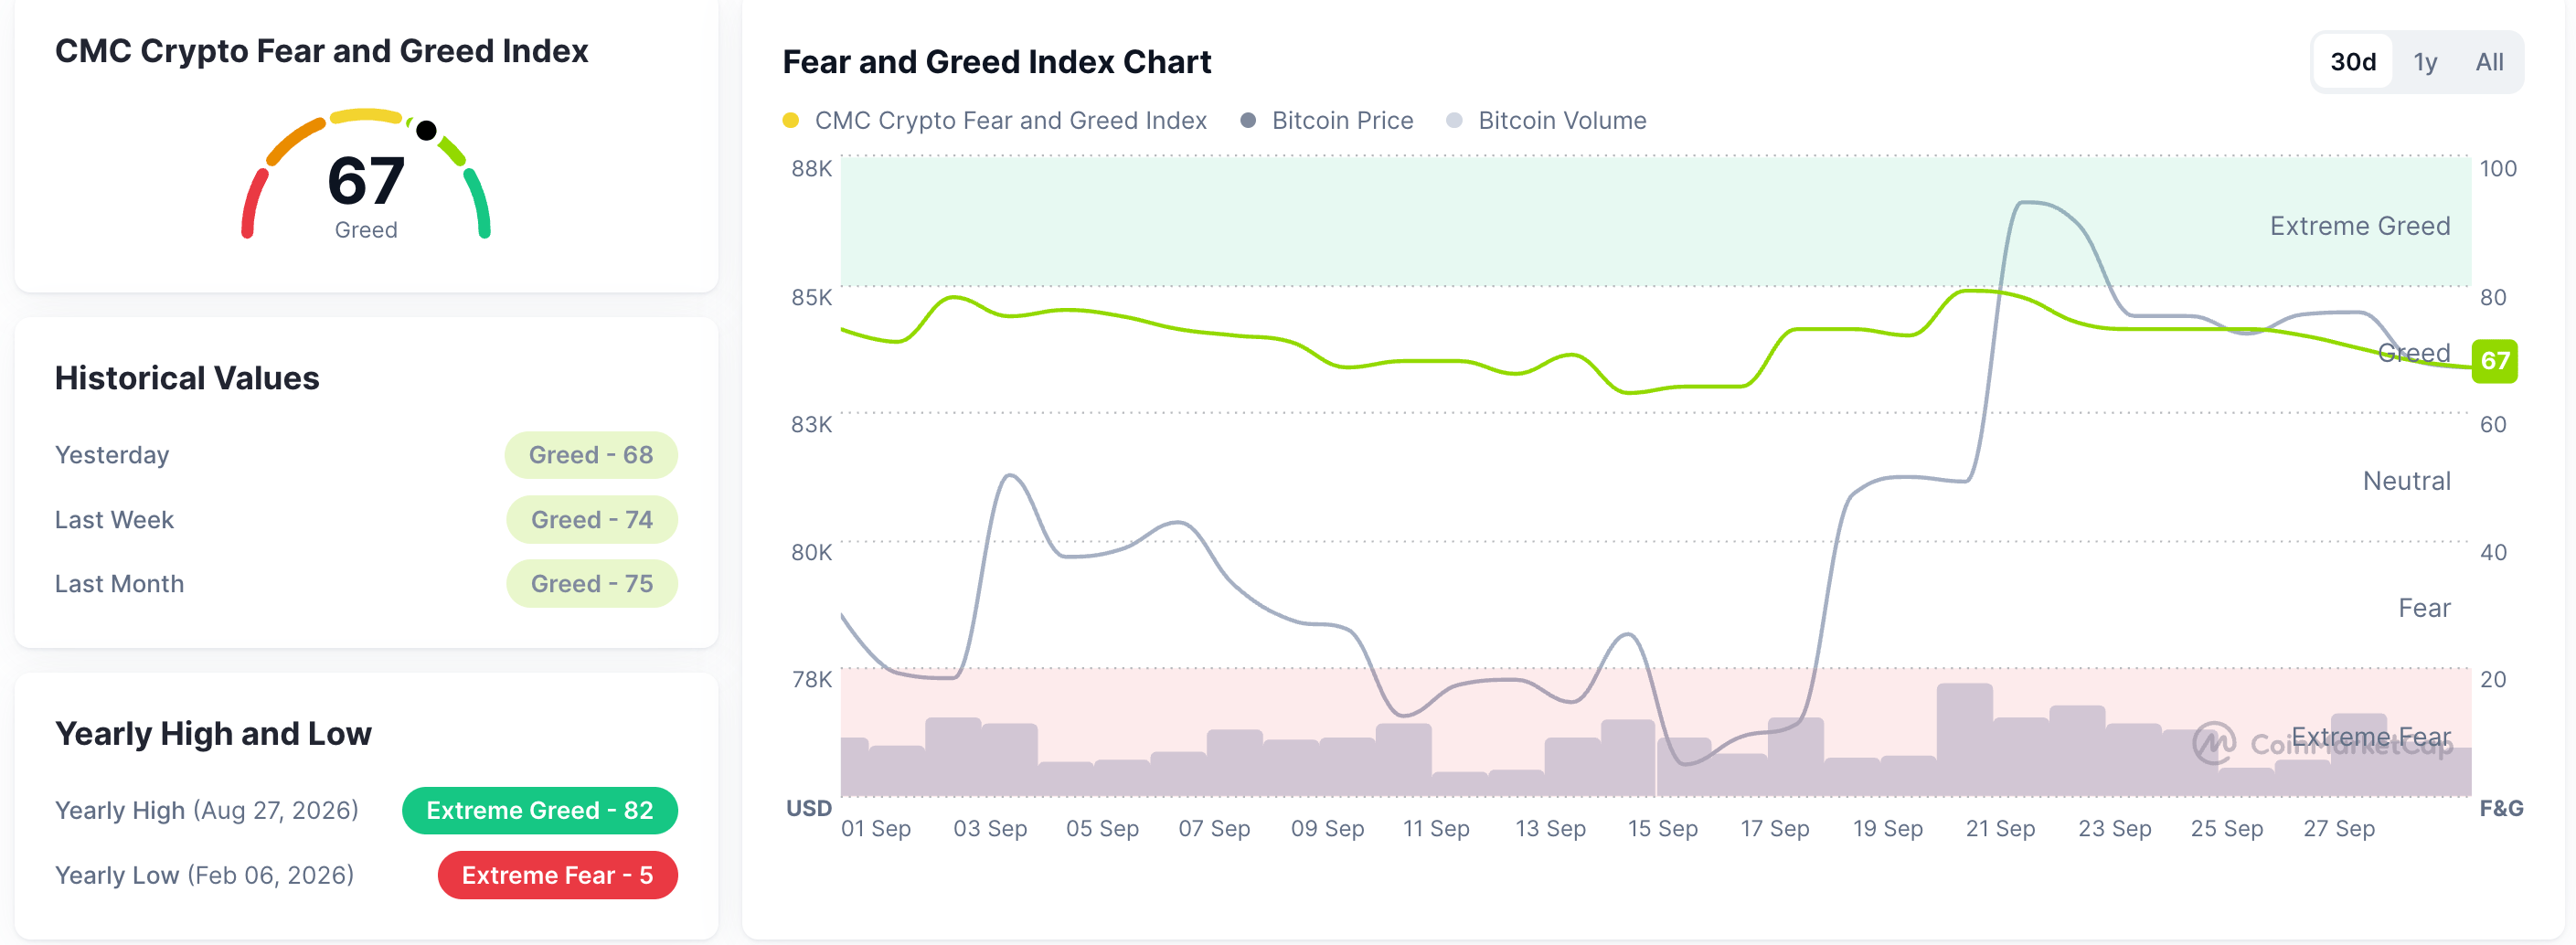
Fear and Greed Index. Source: CoinMarketCap

Technical outlook: Pi Network recovery eyes 50-day EMA breakout

Pi trades at $0.0918 at press time on Wednesday, extending its mild gains from the previous day. Still, the PI token maintains a near-term bearish bias as it tests the breakout of the 50-day EMA at $0.0917 and sits well below the 100- and 200-day EMAs at $0.1002 and $0.1235, respectively.

A confirmed breakout above the 50-day EMA could target the overhead resistance cluster formed by the 50% retracement level of the downswing from $0.1341 to $0.0704 at $0.0990 and the 100-day EMA at $0.1002.

Momentum on the daily chart remains mostly neutral, with the Relative Strength Index (RSI) at 52, rising above the midline, while the Moving Average Convergence Divergence (MACD) remains in the negative territory but holds marginally above its signal line.

Chart Analysis PI/USD (baha Crypto)
PI/USD daily price chart.

Looking down, a potential reversal from the 50-day EMA could test the 23.6% Fibonacci retracement level at $0.0827, reinforced by the July 31 low at $0.0801. Any deeper pullbacks could likely test the all-time low of $0.0704.

(The technical analysis of this story was written with the help of an AI tool. Know more.)

Disclaimer: For information purposes only. Past performance is not indicative of future results.
placeholder
Gold Price Analysis Today: Gold Rebounds After 1.91% Drop as Yields Ease. Is $4,449 Next? Gold fell about 1.91% on August 18 before producing a strong bullish reaction from the 1-hour demand zone in early August 19 trading. RSI is recovering from oversold conditions, but Supertrend remains bearish as traders await the Fed minutes.
Author  Naoufal Seddik
Aug 19, Wed
Gold fell about 1.91% on August 18 before producing a strong bullish reaction from the 1-hour demand zone in early August 19 trading. RSI is recovering from oversold conditions, but Supertrend remains bearish as traders await the Fed minutes.
placeholder
Gold Price Analysis Today: Gold Gains 0.94% as Markets Expect Fed to Hold Rates, Can $4,449 Resistance Break? Gold gained 0.94% on August 17, closing near $4,417.30 as softer US data strengthened expectations for unchanged Fed rates in September. Gold remains bullish, with $4,449.730 resistance and $4,310.650 support in focus.
Author  Naoufal Seddik
Aug 18, Tue
Gold gained 0.94% on August 17, closing near $4,417.30 as softer US data strengthened expectations for unchanged Fed rates in September. Gold remains bullish, with $4,449.730 resistance and $4,310.650 support in focus.
placeholder
Gold Price Analysis Today: Gold Drops 1.32% Despite Lower Fed Rate-Hike Bets, Can $4,313 Support Hold? Gold fell 1.32% on August 13 after rising to $4,449.73, then reversing lower and closing near $4,349.918 below the $4,356.46 support. Softer US inflation data reduced Fed rate hike expectations, but selling pressure still dominated the session. Will $4,313 support hold?
Author  Naoufal Seddik
Aug 14, Fri
Gold fell 1.32% on August 13 after rising to $4,449.73, then reversing lower and closing near $4,349.918 below the $4,356.46 support. Softer US inflation data reduced Fed rate hike expectations, but selling pressure still dominated the session. Will $4,313 support hold?
placeholder
XAUUSD Gold Analysis: Gold Holds Above $4,350 Ahead of US Inflation Data Is $4,500 Next? Gold holds above $4,350 following weak US jobs data. As inflation reports approach and UBS eyes $5,000, can XAUUSD break resistance at $4,435 to rally toward $4,500?
Author  Naoufal Seddik
Aug 12, Wed
Gold holds above $4,350 following weak US jobs data. As inflation reports approach and UBS eyes $5,000, can XAUUSD break resistance at $4,435 to rally toward $4,500?
placeholder
Intel Price Forecast: Nvidia Picked Xeon 6, Invested $5B, Yet Analysts Still Trail INTCIntel Corporation (NASDAQ: INTC) sits at $140.05, holding firm on the ascending trendline within the 2H timeframe. The RSI indicator is currently reading 55.21, positioning it as neutral-
Author  TradingKey
Jul 02, Thu
Intel Corporation (NASDAQ: INTC) sits at $140.05, holding firm on the ascending trendline within the 2H timeframe. The RSI indicator is currently reading 55.21, positioning it as neutral-
goTop
quote