

Aave Price Forecast: Consolidates below $161 as profit-taking emerges after 10% surge

Source Fxstreet
  • Aave corrects slightly, trading below $161 on Wednesday after surging more than 10% the previous day.
  • Santiment data shows AAVE’s NPL metric spiked on Tuesday, signaling increased profit-taking after the sharp price rally.
  • Stani Kulechov, Aave founder, is considering adding an AAVE token burn mechanism to Aavenomics 3.0.

Aave (AAVE) slips below $161 on Wednesday after surging more than 10% the previous day, with on-chain data suggesting increased profit-taking. Meanwhile, Aave founder Stani Kulechov is considering an AAVE token-burn mechanism under Aavenomics 3.0, adding a potential catalyst for AAVE.

Profit-taking weighs on AAVE

Santiment’s Network Realized Profit/Loss (NPL) metric indicates Aave holders are booking profits following its recent price surge.

As shown in the chart below, the metric spiked sharply on Tuesday, reaching its highest level since early May. This spike indicates that holders are, on average, selling their bags at a significant profit, thereby increasing the selling pressure.

Aave NPL chart. Source: Santiment

Aave founder considers AAVE token burn for Aavenomics 3.0

Despite sharp profit-taking, the market sentiment remains bullish for AAVE. Aave founder Stani Kulechov said on Monday that he is considering adding an AAVE token-burn mechanism to Aavenomics 3.0, building on the protocol’s existing revenue-funded buyback program launched in 2025. This proposal could further strengthen AAVE’s tokenomics by reducing the circulating supply alongside the existing buyback mechanism, supporting the bullish long-term outlook.

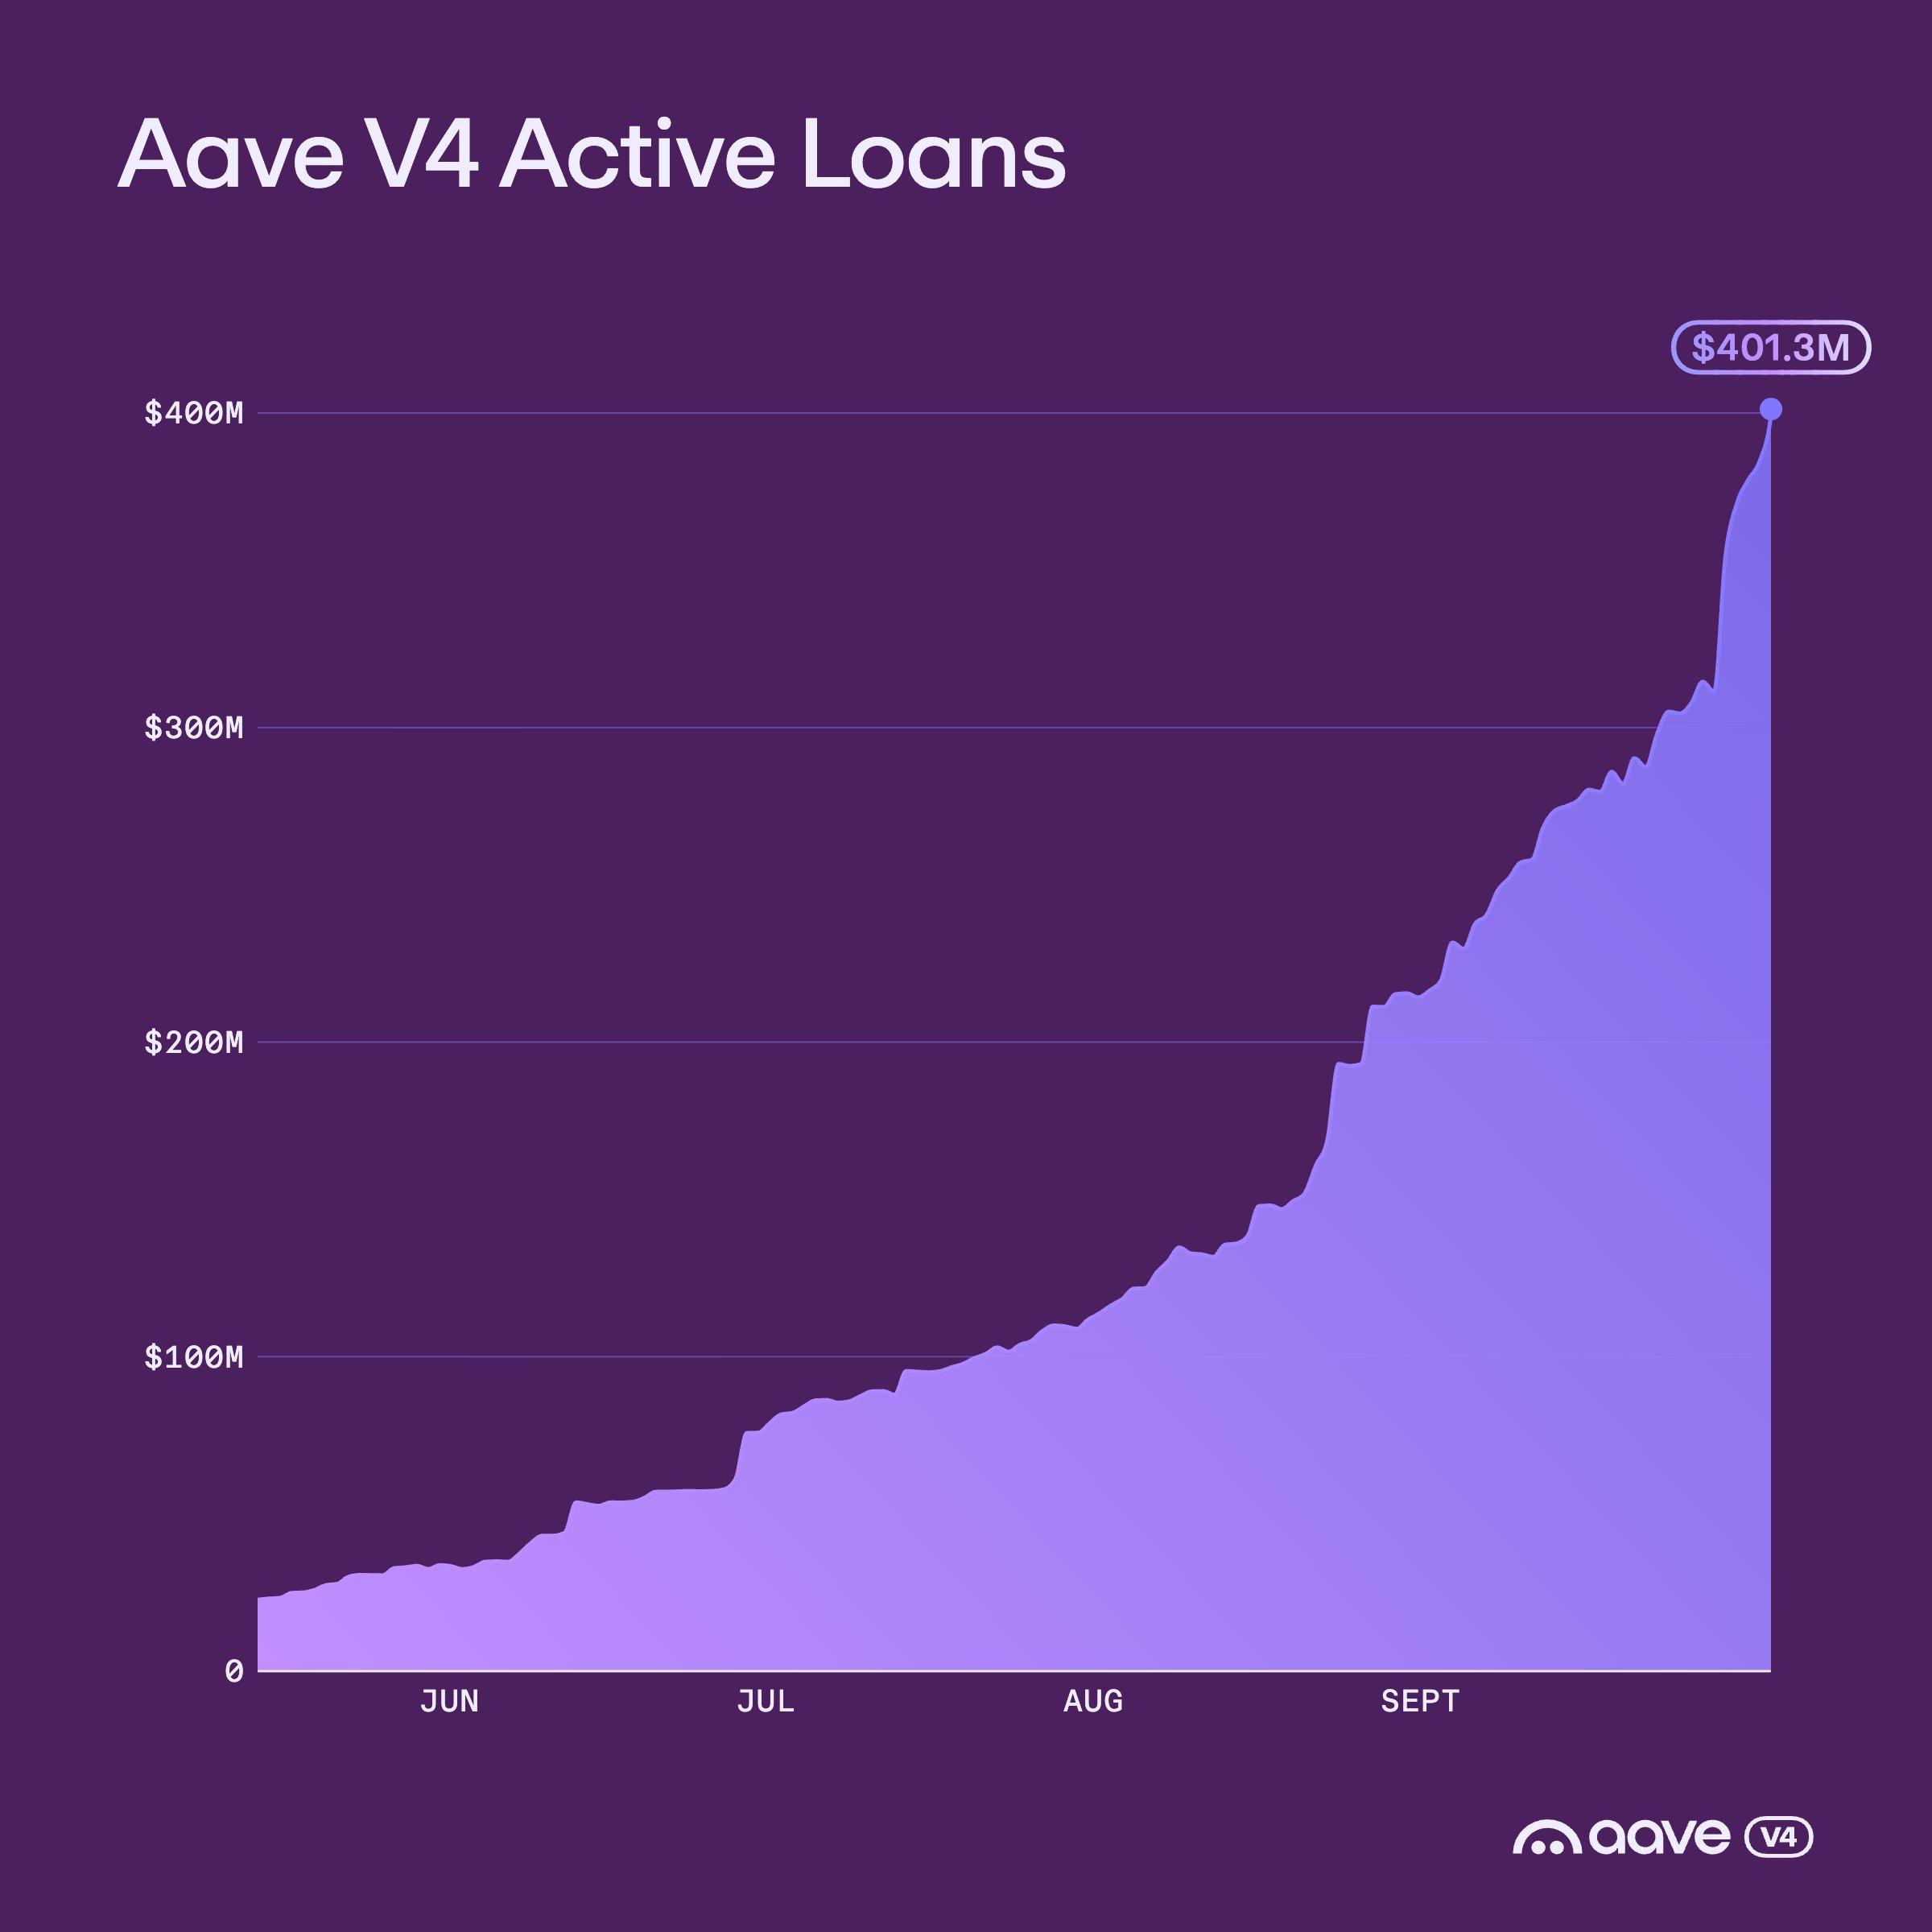
In addition, Aave posted on its X account on Wednesday that its V4 crossed $400 million in active loans, further highlighting strengthening demand and growing activity.
Aave technical outlook: Holds bullish bias

Aave price trades at $160.23 on Wednesday, maintaining a bullish near-term bias as price holds above the 50-day, 100-day and 200-day Exponential Moving Averages (EMAs), clustered between roughly $116.60 and $129.30. 

The horizontal level at $145.10 underpins the recent breakout phase. At the same time, the Relative Strength Index (RSI) at 64 remains in bullish territory without reaching overbought, and the Moving Average Convergence Divergence (MACD) remains positive, suggesting upward momentum is still constructive.

On the topside, immediate resistance is seen at the horizontal barrier near $178.71, where buyers could face profit-taking.

On the downside, initial support appears at $145.10, followed by the 50-day EMA at $129.29 and then the 100-day and 200-day EMAs around $116.72 and $116.59, which together form a deeper demand zone; below these, older structural supports at $88.73 and $60.96 sit far beneath the current market price and would come into focus only in the event of a sharp reversal.
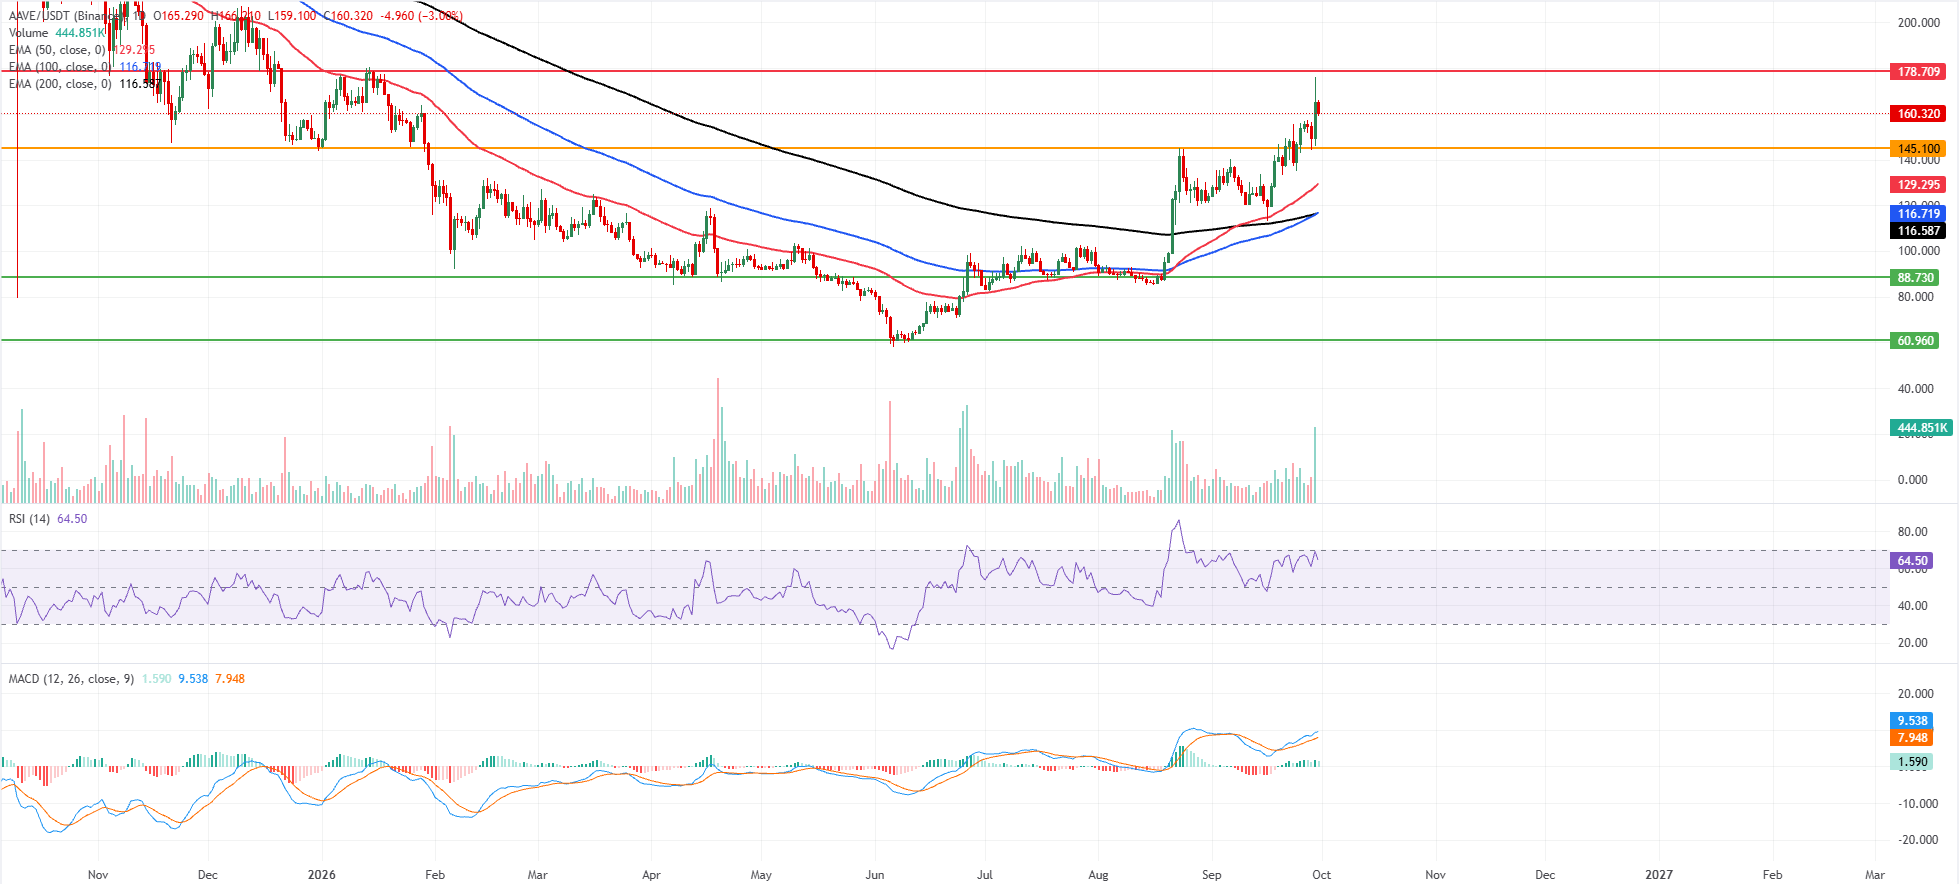
AAVE/USDT daily chart

(The technical analysis of this story was written with the help of an AI tool. Know more.)

Disclaimer: For information purposes only. Past performance is not indicative of future results.
placeholder
Gold Price Analysis Today: Gold Rebounds After 1.91% Drop as Yields Ease. Is $4,449 Next? Gold fell about 1.91% on August 18 before producing a strong bullish reaction from the 1-hour demand zone in early August 19 trading. RSI is recovering from oversold conditions, but Supertrend remains bearish as traders await the Fed minutes.
Author  Naoufal Seddik
Aug 19, Wed
Gold fell about 1.91% on August 18 before producing a strong bullish reaction from the 1-hour demand zone in early August 19 trading. RSI is recovering from oversold conditions, but Supertrend remains bearish as traders await the Fed minutes.
placeholder
Gold Price Analysis Today: Gold Gains 0.94% as Markets Expect Fed to Hold Rates, Can $4,449 Resistance Break? Gold gained 0.94% on August 17, closing near $4,417.30 as softer US data strengthened expectations for unchanged Fed rates in September. Gold remains bullish, with $4,449.730 resistance and $4,310.650 support in focus.
Author  Naoufal Seddik
Aug 18, Tue
Gold gained 0.94% on August 17, closing near $4,417.30 as softer US data strengthened expectations for unchanged Fed rates in September. Gold remains bullish, with $4,449.730 resistance and $4,310.650 support in focus.
placeholder
Gold Price Analysis Today: Gold Drops 1.32% Despite Lower Fed Rate-Hike Bets, Can $4,313 Support Hold? Gold fell 1.32% on August 13 after rising to $4,449.73, then reversing lower and closing near $4,349.918 below the $4,356.46 support. Softer US inflation data reduced Fed rate hike expectations, but selling pressure still dominated the session. Will $4,313 support hold?
Author  Naoufal Seddik
Aug 14, Fri
Gold fell 1.32% on August 13 after rising to $4,449.73, then reversing lower and closing near $4,349.918 below the $4,356.46 support. Softer US inflation data reduced Fed rate hike expectations, but selling pressure still dominated the session. Will $4,313 support hold?
placeholder
XAUUSD Gold Analysis: Gold Holds Above $4,350 Ahead of US Inflation Data Is $4,500 Next? Gold holds above $4,350 following weak US jobs data. As inflation reports approach and UBS eyes $5,000, can XAUUSD break resistance at $4,435 to rally toward $4,500?
Author  Naoufal Seddik
Aug 12, Wed
Gold holds above $4,350 following weak US jobs data. As inflation reports approach and UBS eyes $5,000, can XAUUSD break resistance at $4,435 to rally toward $4,500?
placeholder
Intel Price Forecast: Nvidia Picked Xeon 6, Invested $5B, Yet Analysts Still Trail INTCIntel Corporation (NASDAQ: INTC) sits at $140.05, holding firm on the ascending trendline within the 2H timeframe. The RSI indicator is currently reading 55.21, positioning it as neutral-
Author  TradingKey
Jul 02, Thu
Intel Corporation (NASDAQ: INTC) sits at $140.05, holding firm on the ascending trendline within the 2H timeframe. The RSI indicator is currently reading 55.21, positioning it as neutral-
Related Instrument
goTop
quote