

Chainlink Price Forecast: LINK trims gains after CCIP 2.0 launch, Swift ledger integration

Source Fxstreet
  • Chainlink is down over 4% on Tuesday, trading below $15.00 after a 10% jump the previous day.
  • Chainlink released its new interoperability protocol amid an integration with the Swift ledger. 
  • Institutional demand for LINK holds firm with over $2 million in inflows on Monday.

Chainlink (LINK) edges below $15.00 on Tuesday, trimming its 10% gains from the previous day, driven by the launch of its new Cross-Chain Interoperability Protocol (CCIP) 2.0 and Swift ledger integration for tokenized deposits and 24/7 cross-border payments. LINK-focused Exchange Traded Funds (ETFs) recorded over $2 million in inflows on Monday, following three consecutive weeks of inflows, suggesting strong institutional demand. 

Chainlink must reclaim the $16.60 resistance set by the October 11 low to sustain an uptrend. 

Chainlink connects banks to the SWIFT ledger and releases new CCIP 2.0

Chainlink released two major announcements at the Sibos 2026 event held by Swift on Monday. These announcements include the launch of CCIP 2.0 and its integration with Swift Ledger, enabling financial institutions to read and write access for tokenized deposits and to make 24/7 cross-border payments. The integration positions Chainlink as a bridge between traditional banks and on-chain payment services at a global scale. 

This positioning helps Chainlink gain institutional demand as the broader crypto market shifts its attention toward tokenized assets. LINK-focused ETFs recorded $2.41 million in inflows, extending last week's $6.27 million. In addition, the net inflow over the last three weeks remains positive, reaffirming firm institutional interest in LINK.
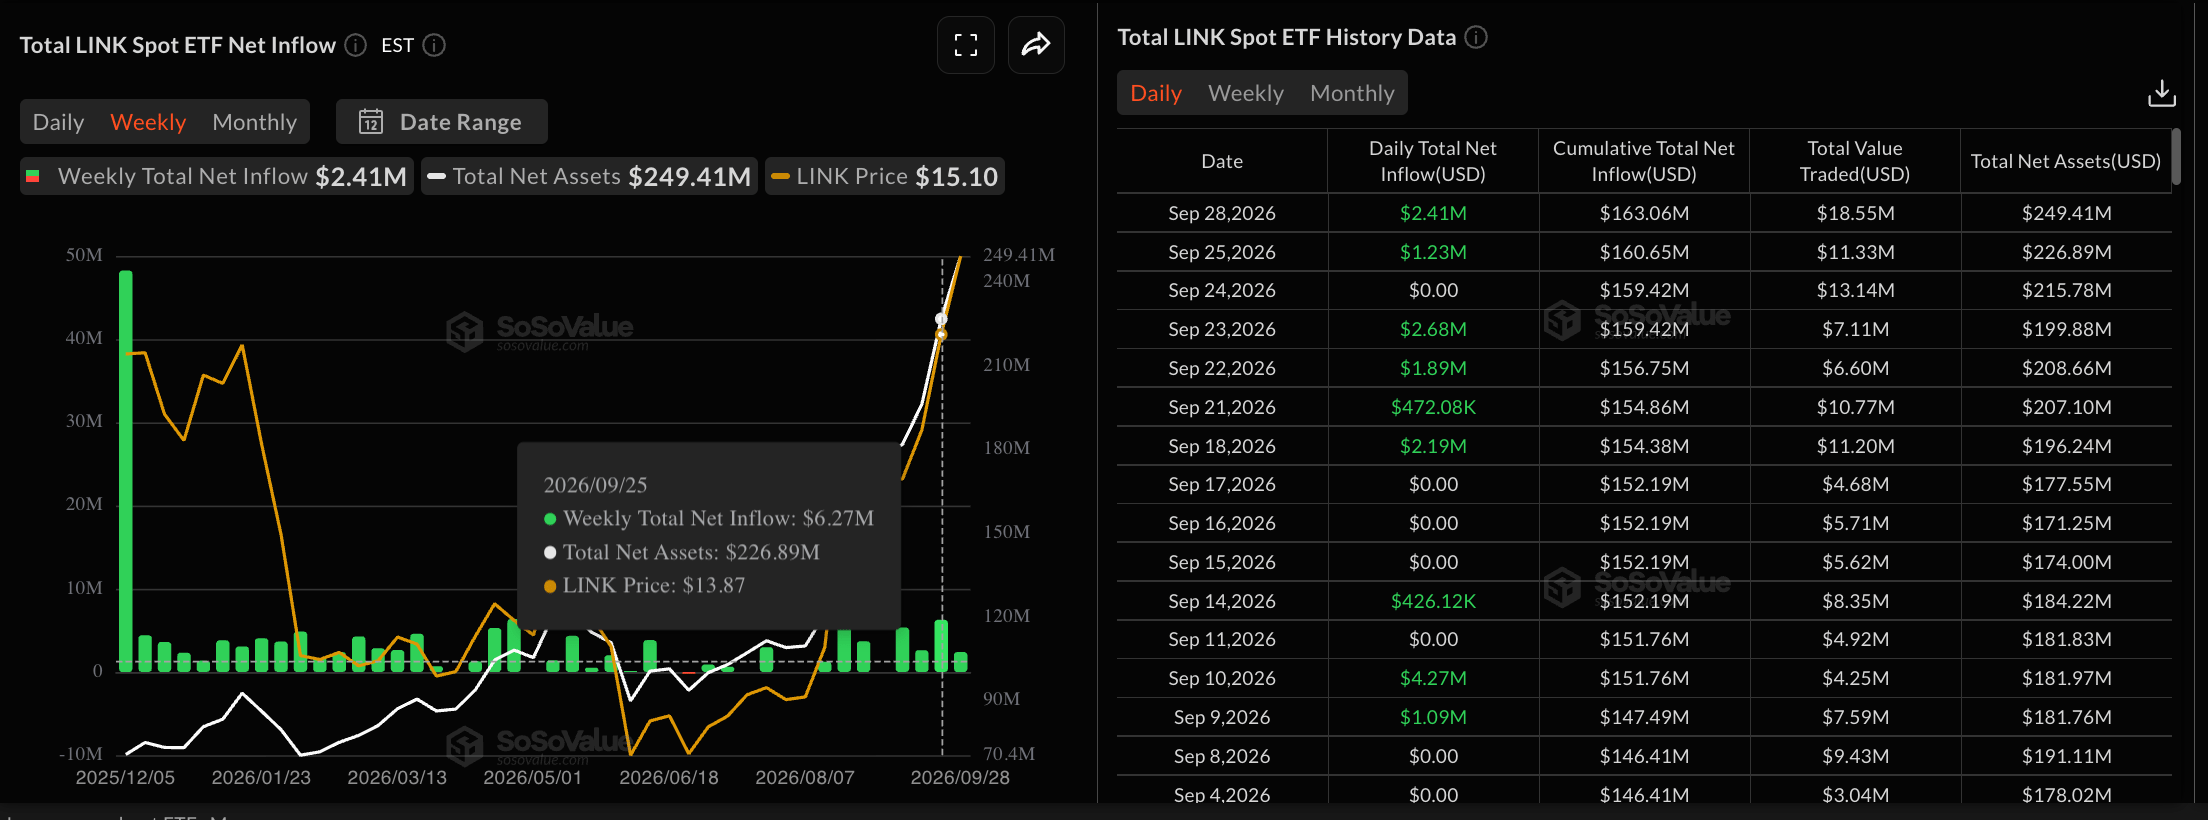
LINK ETFs data. Source: Sosovalue

Technical outlook: Chainlink trims gains as momentum stretches thin

Chainlink trades around $14.75 at press time on Tuesday, extending losses below $15.00 after earlier reaching a high of $15.77. LINK maintains a medium-term bullish bias, holding well above the 50-, 100-, and 200-day Exponential Moving Averages (EMAs) at $11.76, $10.70, and $10.44, respectively.

The rising EMAs suggest a firmly supportive broader trend, with the asset trading at fresh Year-To-Date (YTD) highs. The immediate resistance for LINK aligns with the October 11 low of $16.60, followed by the October 13 high of $20.19.

Momentum conditions reinforce this constructive bias, with the Relative Strength Index (RSI) at 66 hovering near the overbought threshold on the daily chart, while the Moving Average Convergence Divergence (MACD) remains positive, suggesting that buyers still control the near-term tone.

Chart Analysis LINK/USDT (Binance)
HYPE/USD daily price chart.

On the downside, initial technical support appears near the former November 3 low at $14.52, followed by the November 22 low at $11.74, with the 50-day EMA at $11.76 providing additional support.

(The technical analysis of this story was written with the help of an AI tool. Know more.)

Disclaimer: For information purposes only. Past performance is not indicative of future results.
placeholder
OPEC+ Deepens Production Hikes as Hormuz Bottlenecks Stifle Actual SupplyOPEC+ core members will lift July oil quotas by 188,000 barrels per day, but geopolitical shipping constraints and the UAE’s exit keep actual global crude supplies tight.
Author  Mitrade Team
Jun 08, Mon
OPEC+ core members will lift July oil quotas by 188,000 barrels per day, but geopolitical shipping constraints and the UAE’s exit keep actual global crude supplies tight.
placeholder
XRP Price Prediction for July 2026: Can Buyers Finally Break the Downtrend?XRP (XRP) price trades near $1.05, caught between a year-long downtrend and a sudden burst of buying.July has historically rewarded XRP holders. This year the month arrives with on-chain accumulation
Author  Beincrypto
Jun 30, Tue
XRP (XRP) price trades near $1.05, caught between a year-long downtrend and a sudden burst of buying.July has historically rewarded XRP holders. This year the month arrives with on-chain accumulation
placeholder
XAUUSD Gold Analysis: Gold Holds Above $4,350 Ahead of US Inflation Data Is $4,500 Next? Gold holds above $4,350 following weak US jobs data. As inflation reports approach and UBS eyes $5,000, can XAUUSD break resistance at $4,435 to rally toward $4,500?
Author  Naoufal Seddik
Aug 12, Wed
Gold holds above $4,350 following weak US jobs data. As inflation reports approach and UBS eyes $5,000, can XAUUSD break resistance at $4,435 to rally toward $4,500?
placeholder
Gold Price Analysis Today: Gold Drops 1.32% Despite Lower Fed Rate-Hike Bets, Can $4,313 Support Hold? Gold fell 1.32% on August 13 after rising to $4,449.73, then reversing lower and closing near $4,349.918 below the $4,356.46 support. Softer US inflation data reduced Fed rate hike expectations, but selling pressure still dominated the session. Will $4,313 support hold?
Author  Naoufal Seddik
Aug 14, Fri
Gold fell 1.32% on August 13 after rising to $4,449.73, then reversing lower and closing near $4,349.918 below the $4,356.46 support. Softer US inflation data reduced Fed rate hike expectations, but selling pressure still dominated the session. Will $4,313 support hold?
placeholder
Gold Price Analysis Today: Gold Gains 0.94% as Markets Expect Fed to Hold Rates, Can $4,449 Resistance Break? Gold gained 0.94% on August 17, closing near $4,417.30 as softer US data strengthened expectations for unchanged Fed rates in September. Gold remains bullish, with $4,449.730 resistance and $4,310.650 support in focus.
Author  Naoufal Seddik
Aug 18, Tue
Gold gained 0.94% on August 17, closing near $4,417.30 as softer US data strengthened expectations for unchanged Fed rates in September. Gold remains bullish, with $4,449.730 resistance and $4,310.650 support in focus.
Related Instrument
goTop
quote