

Hyperliquid Price Forecast: HYPE pares gains as market focus shifts to tokenization assets

Source Fxstreet
  • Hyperliquid extends losses on Tuesday after a 5% decline the previous day.
  • Zero ETF inflows on Monday risk a net-negative month in September.
  • The technical outlook for HYPE indicates a mild downside risk as bullish momentum eases.

Hyperliquid (HYPE) faces intense selling pressure, declining nearly 2% on Tuesday after losing over 5% the previous day. The institutional demand for HYPE continues to fluctuate, risking a net-negative monthly flow in September. The technical outlook for HYPE warns of deeper losses as momentum starts to shift bearish. 

Institutional demand shifts from Hyperliquid

Hyperliquid-focused Exchange Traded Funds (ETFs) recorded zero net inflows on Monday, following a $9.25 million inflow last week. Despite two consecutive weekly inflows, HYPE ETFs have recorded a net monthly outflow of $1.83 million so far, down from $66.33 million in August. This indicates that the institutional demand has eased significantly and could weigh on the exchange token.
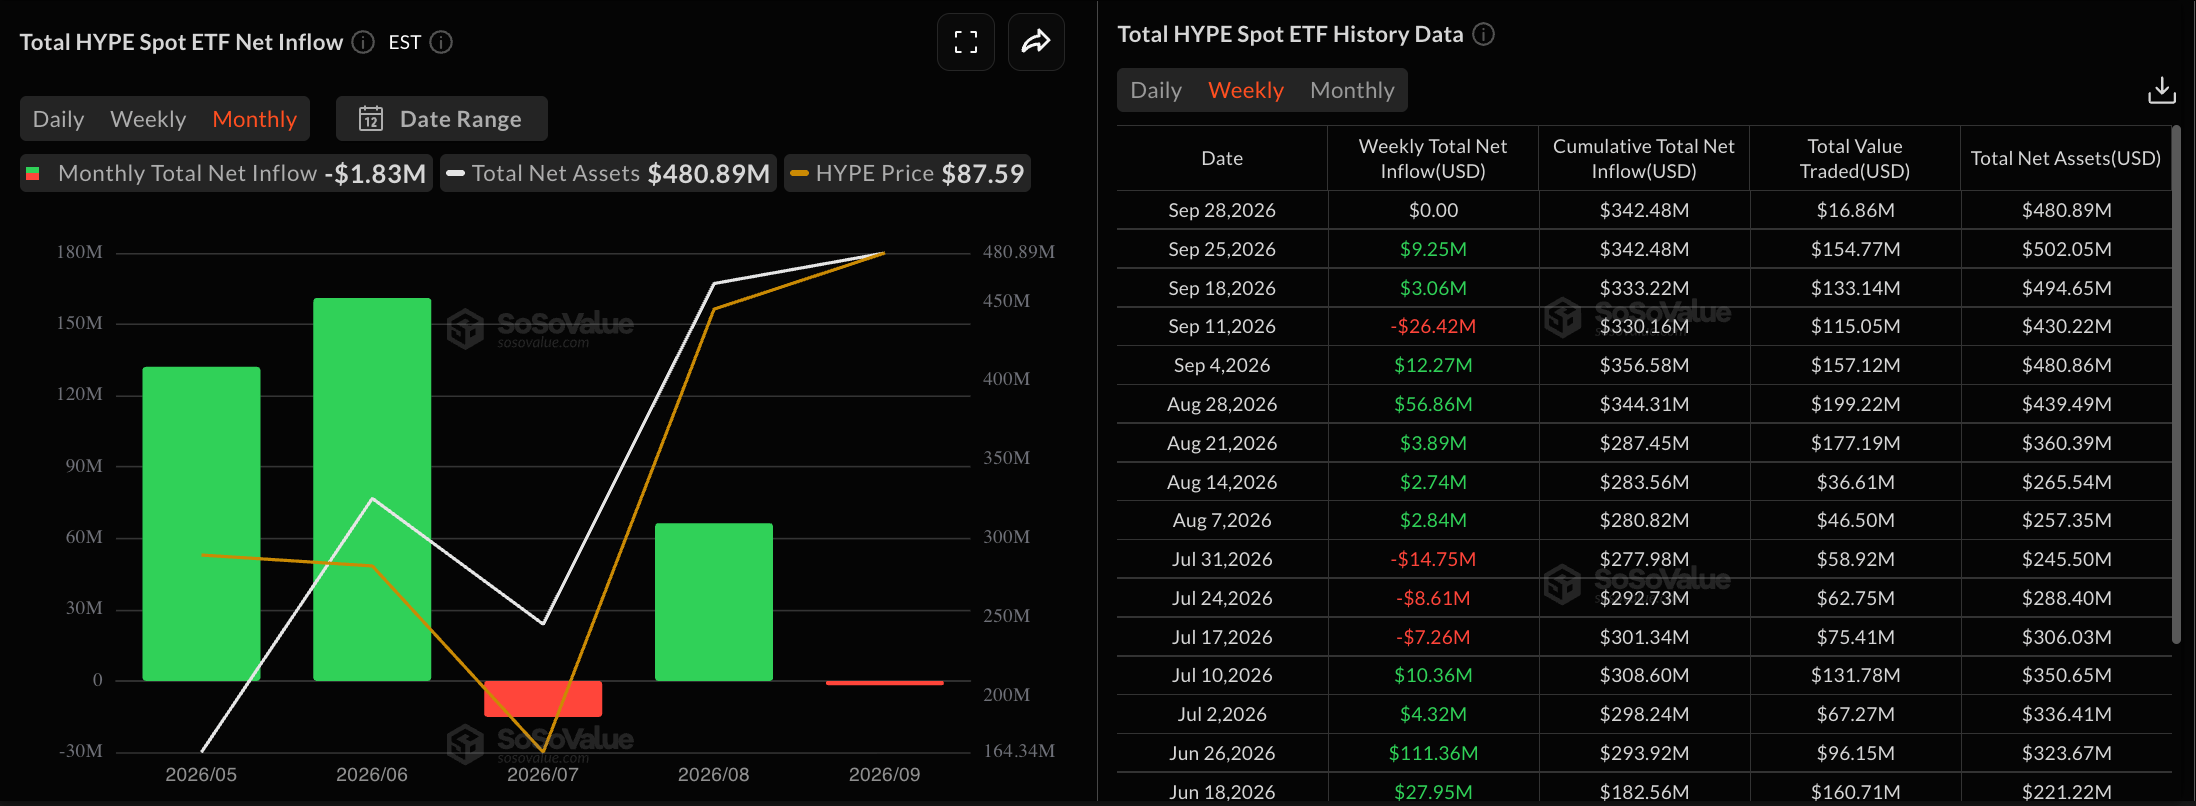
HYPE ETFs data. Source: Sosovalue

On the other hand, the Quant (QNT) and Ondo (ONDO) have rallied so far this week, driven by tokenized bank deposits and tokenized portfolio strategies. This reflects market attention and capital rotation toward tokenized assets.

Technical outlook: Hyperliquid's correction gains traction

Hyperliquid trades below $86 on Tuesday, extending its pullback from last week's high of $98.03. HYPE shows a bearish near-term bias as the pair slips below the 50- and 100-period Exponential Moving Averages (EMAs) on the four-hour chart at $90.77 and $88.81, respectively, while holding modestly above the 200-period EMA at $84.40, which acts as underlying trend support.

Momentum grows weak, with the Relative Strength Index (RSI) near the oversold band around 32 on the four-hour chart, while the Moving Average Convergence Divergence (MACD) declines into the negative territory, suggesting firm downside pressure.

The immediate support for HYPE aligns with the 200-period EMA at $84.40, reinforced by the September 4 low at $83.56. A confirmed breakout below this level could target the August 22 low at $77.02.

On the flip side, HYPE must reclaim the overhead 50- and 100-period EMAs around $90.77 and $88.81 to reinstate an uptrend, which could open the path toward the $98.03 swing high.

Chart Analysis HYPE/USD (baha Crypto)
HYPE/USD daily price chart.

(The technical analysis of this story was written with the help of an AI tool. Know more.)

Disclaimer: For information purposes only. Past performance is not indicative of future results.
placeholder
XRP Price Prediction for July 2026: Can Buyers Finally Break the Downtrend?XRP (XRP) price trades near $1.05, caught between a year-long downtrend and a sudden burst of buying.July has historically rewarded XRP holders. This year the month arrives with on-chain accumulation
Author  Beincrypto
Jun 30, Tue
XRP (XRP) price trades near $1.05, caught between a year-long downtrend and a sudden burst of buying.July has historically rewarded XRP holders. This year the month arrives with on-chain accumulation
placeholder
XAUUSD Gold Analysis: Gold Holds Above $4,350 Ahead of US Inflation Data Is $4,500 Next? Gold holds above $4,350 following weak US jobs data. As inflation reports approach and UBS eyes $5,000, can XAUUSD break resistance at $4,435 to rally toward $4,500?
Author  Naoufal Seddik
Aug 12, Wed
Gold holds above $4,350 following weak US jobs data. As inflation reports approach and UBS eyes $5,000, can XAUUSD break resistance at $4,435 to rally toward $4,500?
placeholder
Gold Price Analysis Today: Gold Drops 1.32% Despite Lower Fed Rate-Hike Bets, Can $4,313 Support Hold? Gold fell 1.32% on August 13 after rising to $4,449.73, then reversing lower and closing near $4,349.918 below the $4,356.46 support. Softer US inflation data reduced Fed rate hike expectations, but selling pressure still dominated the session. Will $4,313 support hold?
Author  Naoufal Seddik
Aug 14, Fri
Gold fell 1.32% on August 13 after rising to $4,449.73, then reversing lower and closing near $4,349.918 below the $4,356.46 support. Softer US inflation data reduced Fed rate hike expectations, but selling pressure still dominated the session. Will $4,313 support hold?
placeholder
Gold Price Analysis Today: Gold Gains 0.94% as Markets Expect Fed to Hold Rates, Can $4,449 Resistance Break? Gold gained 0.94% on August 17, closing near $4,417.30 as softer US data strengthened expectations for unchanged Fed rates in September. Gold remains bullish, with $4,449.730 resistance and $4,310.650 support in focus.
Author  Naoufal Seddik
Aug 18, Tue
Gold gained 0.94% on August 17, closing near $4,417.30 as softer US data strengthened expectations for unchanged Fed rates in September. Gold remains bullish, with $4,449.730 resistance and $4,310.650 support in focus.
placeholder
Gold Price Analysis Today: Gold Rebounds After 1.91% Drop as Yields Ease. Is $4,449 Next? Gold fell about 1.91% on August 18 before producing a strong bullish reaction from the 1-hour demand zone in early August 19 trading. RSI is recovering from oversold conditions, but Supertrend remains bearish as traders await the Fed minutes.
Author  Naoufal Seddik
Aug 19, Wed
Gold fell about 1.91% on August 18 before producing a strong bullish reaction from the 1-hour demand zone in early August 19 trading. RSI is recovering from oversold conditions, but Supertrend remains bearish as traders await the Fed minutes.
goTop
quote