


Meme Coins Price Prediction: Dogecoin, Shiba Inu, and Pepe – Bullish trend in works
- Dogecoin edges lower on Monday, hovering around $0.095 as buyers continue to struggle to surpass the $0.1000 mark.
- Shiba Inu is experiencing a mild pullback, extending a consolidation between the 200-day EMA and a key Fibonacci resistance level.
- Pepe holds steady after Friday's 2% loss, reflecting a lack of momentum to rally after a long-resistance trendline breakout.
Meme coins including Dogecoin (DOGE), Shiba Inu (SHIB), and Pepe (PEPE) make a soft start on Monday as key resistance levels capped gains last week. The technical outlook for DOGE, SHIB, and PEPE indicates a mixed bias, as prices remain above their 200-day Exponential Moving Average (EMA) while momentum wanes.
Dogecoin gains institutional interest
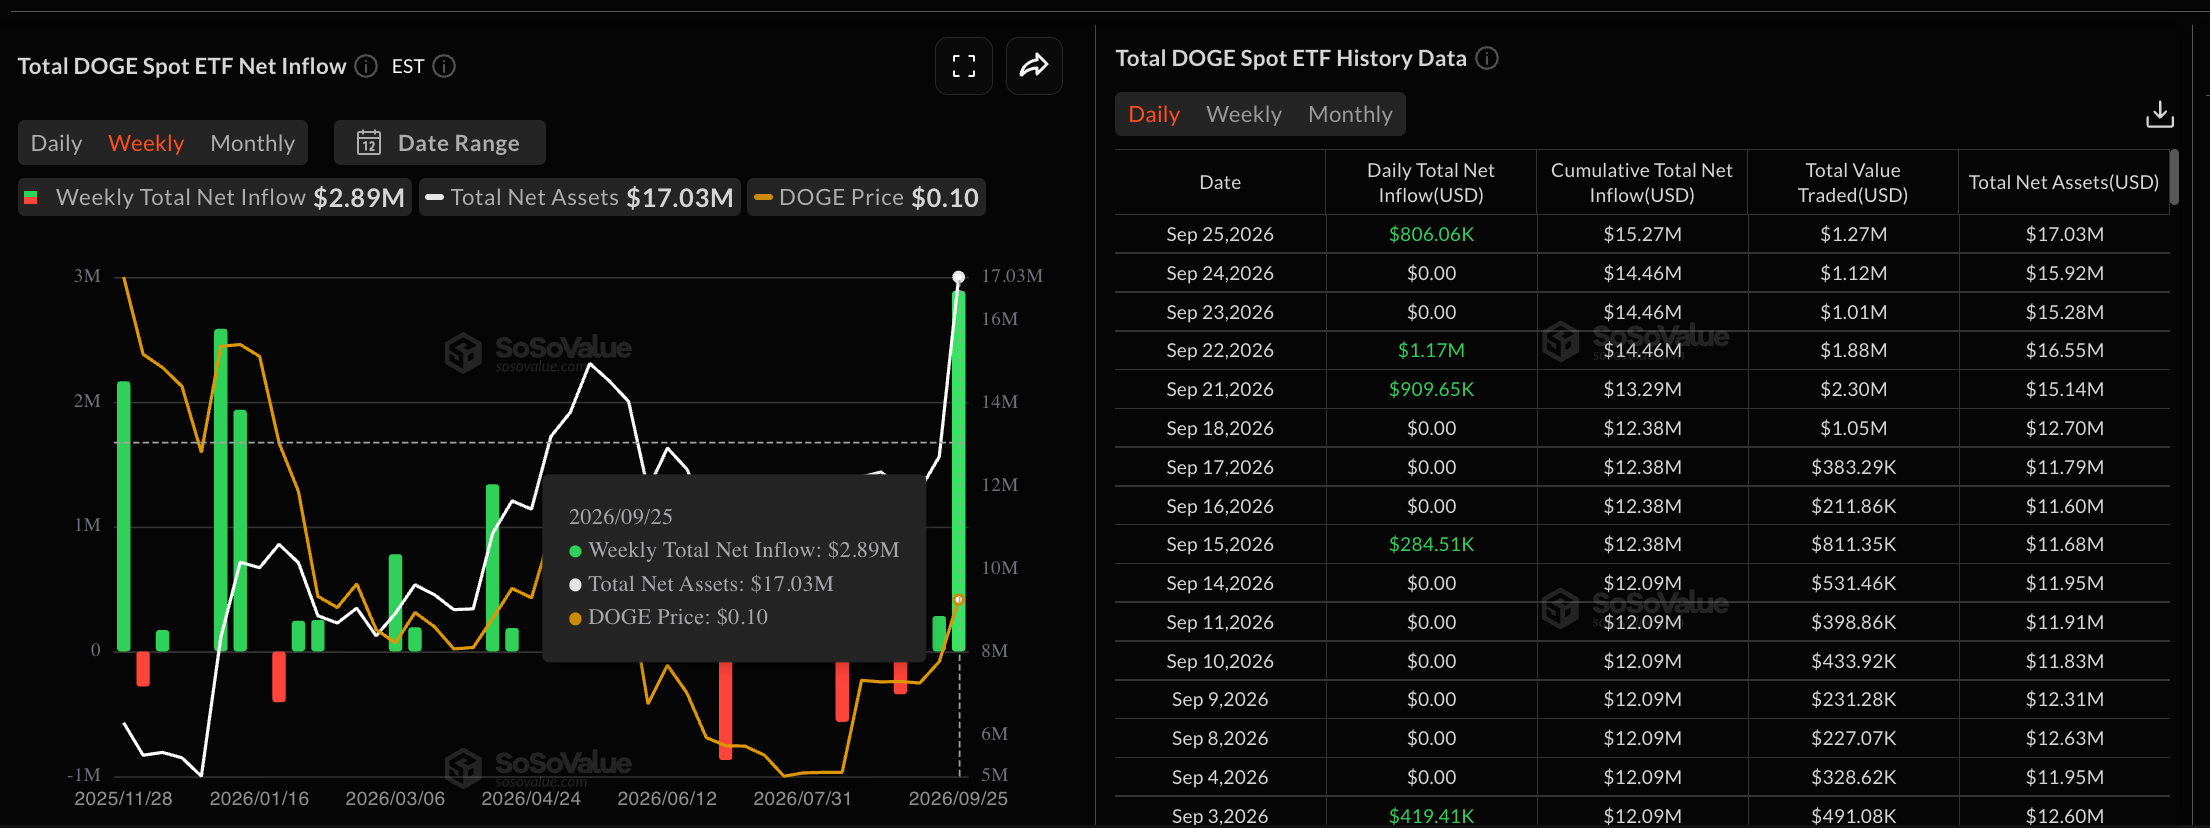
Dogecoin rallied 11% last week but remains capped below the $0.1000 psychological level amid renewed institutional interest in the meme coin. SoSoValue data shows DOGE-focused Exchange Traded Funds (ETFs) recorded $2.89 million in inflows last week, marking their largest weekly net inflow since inception. Typically, renewed ETF inflows suggest long-term upside in crypto assets, driven by institutional demand and a positive shift in retail and large-wallet investors' sentiment.
Dogecoin trades around $0.0950 at press time on Monday, maintaining a bullish bias above the 50-, 100-, and 200-day Exponential Moving Averages (EMAs) around $0.0862, $0.0849, and $0.0933, respectively. These EMAs form a dense support layer for the meme coin.
Momentum indicators on the daily chart show mild weakness, as the Moving Average Convergence Divergence (MACD) stalls above its signal line with a contracting histogram. At the same time, the Relative Strength Index (RSI) near 57 declines toward the midline, reaffirming the fading of bullish momentum.
Looking up, Dogecoin must reclaim the $0.1000 psychological barrier to extend the upside toward the $0.1161 supply zone.
On the downside, initial support is at the 200-day EMA at $0.0933, with deeper support at the 50-day EMA at $0.0862 and the 100-day EMA at $0.0849.
Shiba Inu holds above key support amid rising downside pressure
Shiba Inu edges lower on Monday, trading below $0.00000600 despite an 8% rise the previous week. The meme coin retraces toward the 200-day EMA at $0.00000564 as the recent recovery remains capped at the 78.6% Fibonacci retracement level at $0.00000613, measured from $0.00000670 to $0.00000405.
Momentum weakens with the RSI sliding to 57 on the daily chart, indicating an easing in buying pressure.
For a sustained uptrend, SHIB must confirm a bullish breakout above $0.00000613 to open the door toward the $0.00000670 swing high.
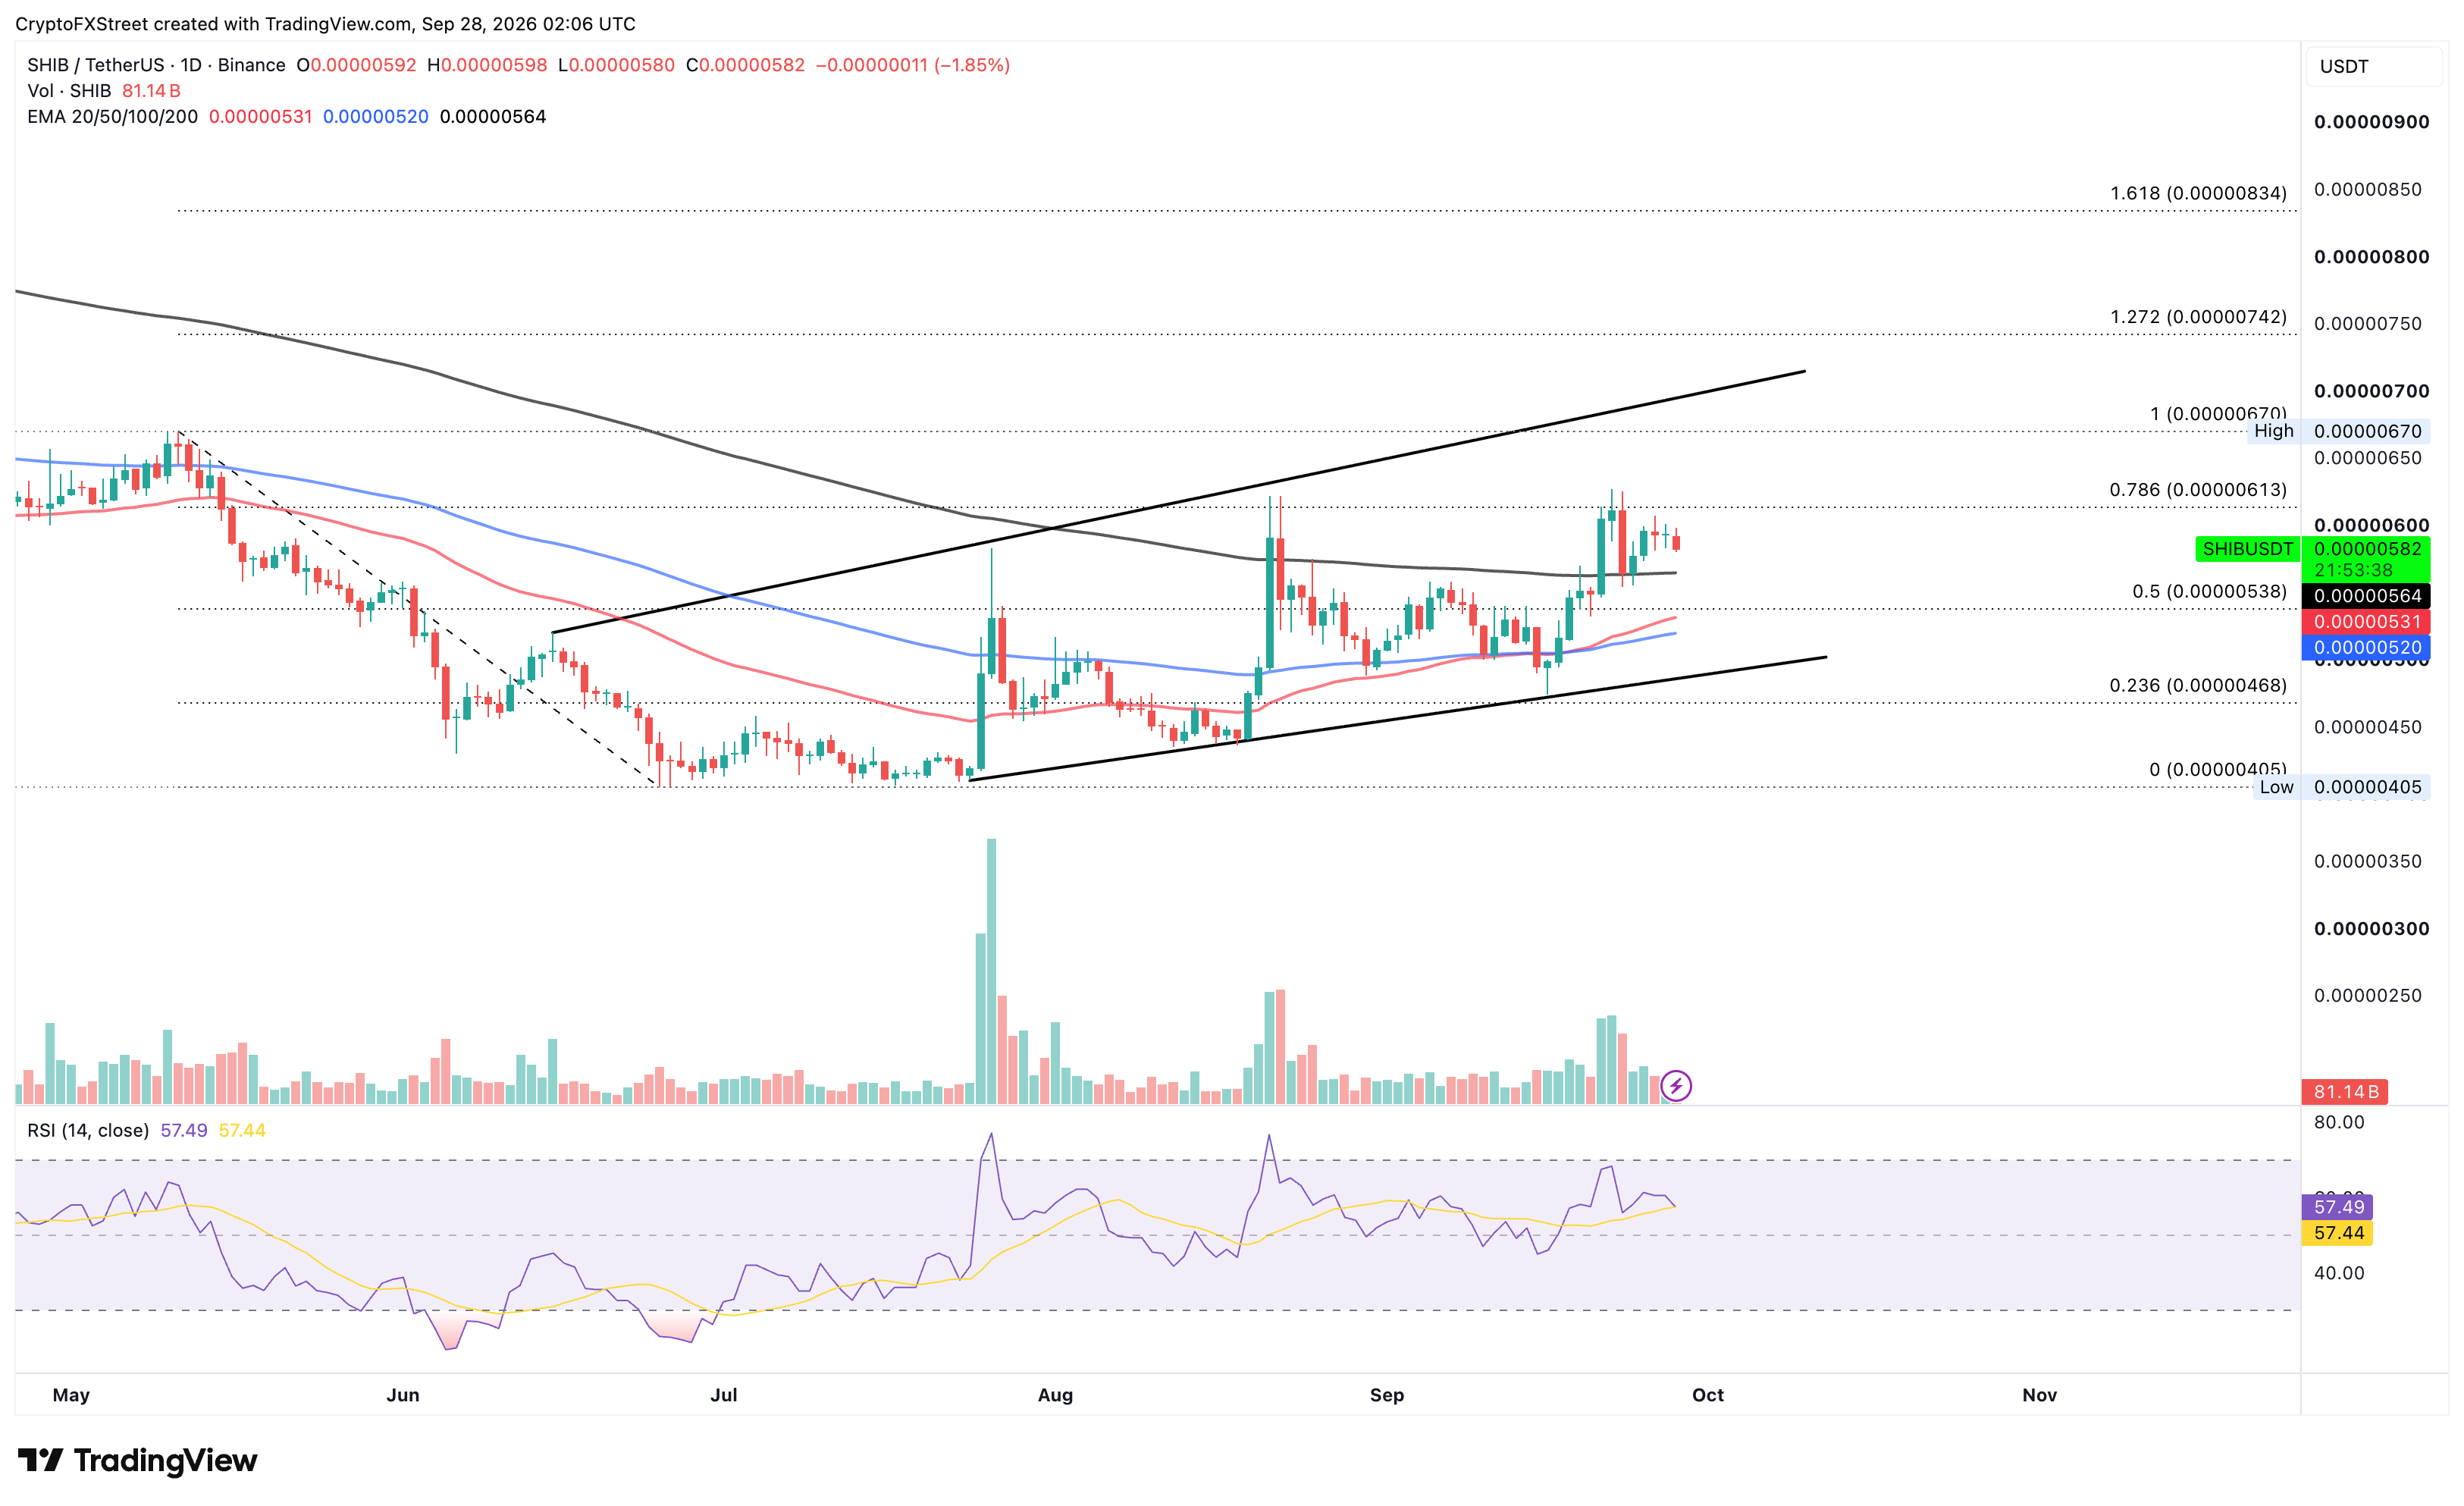
A decisive close below the 200-day EMA at $0.00000564 could target the 50% retracement level at $0.00000538, with support from the 50- and 100-day EMAs at $0.00000531 and $0.00000520, respectively.
Pepe struggles to extend its trendline breakout rally
Pepe hovers above $0.00000400 at press time on Monday, trading in the red after a 9% rebound the previous week. The meme coin reflects an easing in bullish recovery as the price remains capped below the $0.00000500 psychological level.
The 127.2% Fibonacci extension level, measured from $0.00000456 to $0.00000320, at $0.00000502 reinforces the upside barrier. A confirmed breakout above this level could renew the bullish trend, targeting the 161.8% extension level at $0.00000567. The RSI eases to 57 on the daily chart, reaffirming the reduced upside traction.
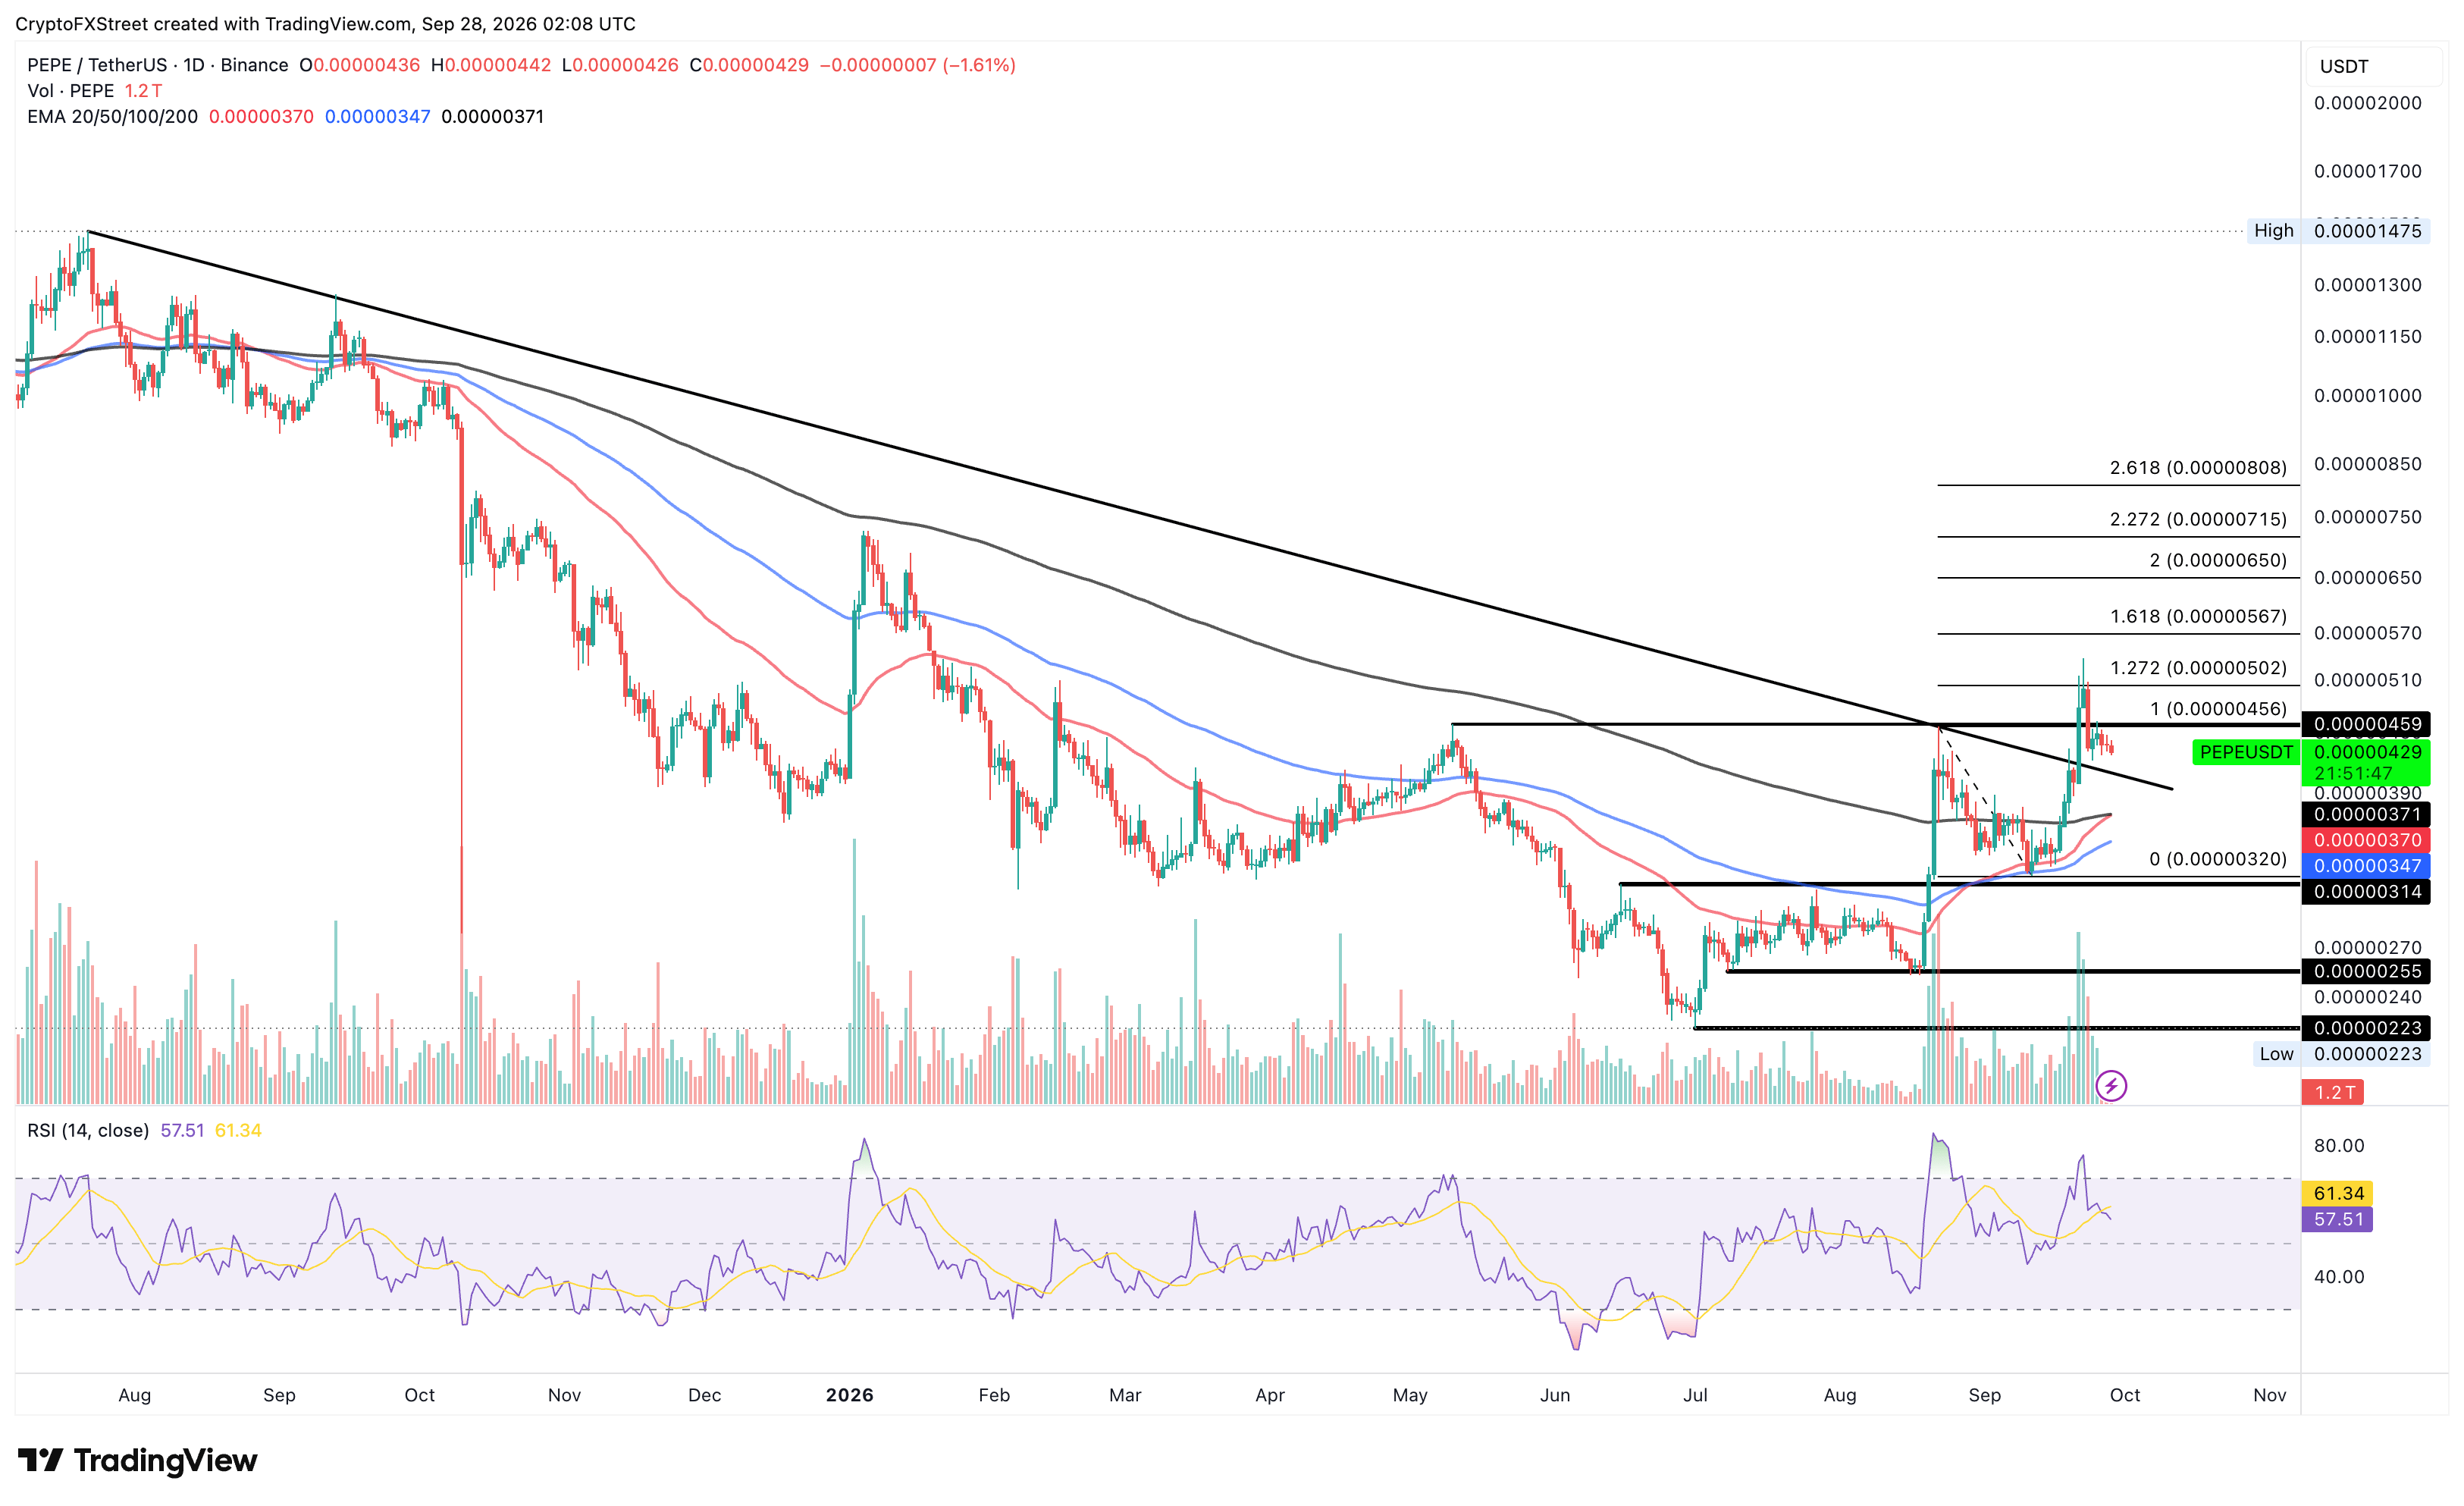
Looking down, the initial support for PEPE aligns with the broken trendline near $0.00000420. Any deeper pullback could nullify the chances of extending the breakout rally, targeting the 200- and 50-day EMAs around $0.00000370 and $0.00000371, which are on the verge of forming a Golden Cross.
(The technical analysis of this story was written with the help of an AI tool. Know more.)
Recommended Articles


