

Peter Brandt's $8,600 Ether chart hinges on a first break above $5,000

Source Cryptopolitan

Peter Brandt’s long-term Ether chart has a target of $8,600, but only if ETH breaks $5,000.

The token is trading near $2,693, which means the first hurdle alone is about 86% higher.

CME futures mark the top line at $8,674.50

The chart, which was based on CME Ether futures, was posted on X by Brandt on September 21. It reads $8,674.50, but he rounds it down to $8,600.

“It implies an eventual move to 8,600 once 5,000 is handled,” Brandt wrote. He did not give a date or timetable for the forecast.

From $2,693 to $5,000 takes a gain of about 86%. The full route to $8,600 means a rise of about 219%.

The closer picture begins at $3,000, the first short-term resistance. ETH has climbed from approximately $2,360 earlier in September.

Then there’s the $5,000 threshold Brandt uses as the gate. The target is $8,600, another 72% from a $5,000 print.
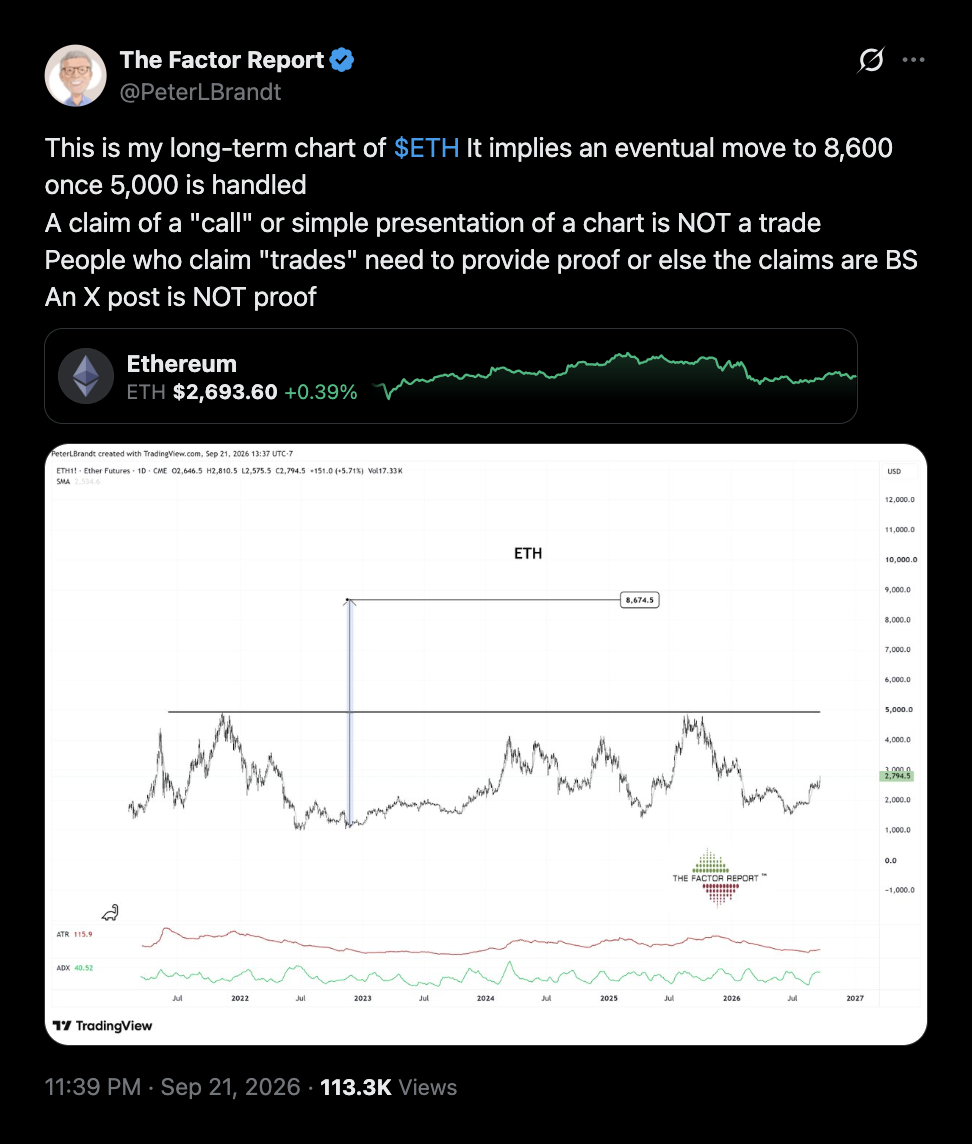
Ether must clear $5,000 before Peter Brandt's $8,600 chart target comes into play.
Peter Brandt’s long-term ETH chart on X.

The same no-trade caveat covered XRP’s $5.40 path

“A claim of a ‘call’ or simple presentation of a chart is NOT a trade,” Brandt wrote. People who claim trades need to provide proof, he added.

“An X post is NOT proof,” he said.

He gave the same caveat on another long-term XRP chart the same day, which charted a path to $5.40, Cryptopolitan reported.

Brandt has been trading commodities since 1976 and founded Factor Trading in 1980.

Cryptopolitan reports that on September 21, US spot Ether ETFs experienced the biggest single-day inflow since October 7, 2025.

The haul came to around $270 million.

Don’t just read crypto news. Understand it. Subscribe to our newsletter. It's free.

Disclaimer: For information purposes only. Past performance is not indicative of future results.
placeholder
Gold Price Analysis Today: Gold Rebounds After 1.91% Drop as Yields Ease. Is $4,449 Next? Gold fell about 1.91% on August 18 before producing a strong bullish reaction from the 1-hour demand zone in early August 19 trading. RSI is recovering from oversold conditions, but Supertrend remains bearish as traders await the Fed minutes.
Author  Naoufal Seddik
Aug 19, Wed
Gold fell about 1.91% on August 18 before producing a strong bullish reaction from the 1-hour demand zone in early August 19 trading. RSI is recovering from oversold conditions, but Supertrend remains bearish as traders await the Fed minutes.
placeholder
Gold Price Analysis Today: Gold Gains 0.94% as Markets Expect Fed to Hold Rates, Can $4,449 Resistance Break? Gold gained 0.94% on August 17, closing near $4,417.30 as softer US data strengthened expectations for unchanged Fed rates in September. Gold remains bullish, with $4,449.730 resistance and $4,310.650 support in focus.
Author  Naoufal Seddik
Aug 18, Tue
Gold gained 0.94% on August 17, closing near $4,417.30 as softer US data strengthened expectations for unchanged Fed rates in September. Gold remains bullish, with $4,449.730 resistance and $4,310.650 support in focus.
placeholder
Gold Price Analysis Today: Gold Drops 1.32% Despite Lower Fed Rate-Hike Bets, Can $4,313 Support Hold? Gold fell 1.32% on August 13 after rising to $4,449.73, then reversing lower and closing near $4,349.918 below the $4,356.46 support. Softer US inflation data reduced Fed rate hike expectations, but selling pressure still dominated the session. Will $4,313 support hold?
Author  Naoufal Seddik
Aug 14, Fri
Gold fell 1.32% on August 13 after rising to $4,449.73, then reversing lower and closing near $4,349.918 below the $4,356.46 support. Softer US inflation data reduced Fed rate hike expectations, but selling pressure still dominated the session. Will $4,313 support hold?
placeholder
XAUUSD Gold Analysis: Gold Holds Above $4,350 Ahead of US Inflation Data Is $4,500 Next? Gold holds above $4,350 following weak US jobs data. As inflation reports approach and UBS eyes $5,000, can XAUUSD break resistance at $4,435 to rally toward $4,500?
Author  Naoufal Seddik
Aug 12, Wed
Gold holds above $4,350 following weak US jobs data. As inflation reports approach and UBS eyes $5,000, can XAUUSD break resistance at $4,435 to rally toward $4,500?
placeholder
Intel Price Forecast: Nvidia Picked Xeon 6, Invested $5B, Yet Analysts Still Trail INTCIntel Corporation (NASDAQ: INTC) sits at $140.05, holding firm on the ascending trendline within the 2H timeframe. The RSI indicator is currently reading 55.21, positioning it as neutral-
Author  TradingKey
Jul 02, Thu
Intel Corporation (NASDAQ: INTC) sits at $140.05, holding firm on the ascending trendline within the 2H timeframe. The RSI indicator is currently reading 55.21, positioning it as neutral-
goTop
quote