

Solana Price Forecast: SOL extends rally as tokenized equity holders hit a record

Source Fxstreet
  • Solana climbs above $111.70 on Monday after gaining nearly 12% last week.
  • SOL announced on X that its tokenized equity ecosystem hit a new all-time high, with 850,000 unique on-chain holders.
  • Improving momentum indicators and strengthening institutional demand support further gains in SOL.

Solana (SOL) extends its gains, trading above $111.70 at the time of writing on Monday after rallying nearly 12% last week. The bullish price action comes as growth in Solana’s tokenized equity ecosystem reaches a new milestone. Meanwhile, improving momentum indicators and strengthening institutional demand point to further gains in SOL.

Solana tokenized equities ecosystem reaches a new milestone

Solana announced on its official X post on Sunday that its tokenized equities hit a new all-time high (ATH) of 850,000 unique on-chain holders. This indicates continued growth in tokenized assets on the network, highlighting market confidence and growing participation, which could boost the SOL price in the long term.

Strengthening institutional demand

Institutional demand for Solana has strengthened. SoSoValue data showed that SOL Exchange-Traded Funds (ETFs) recorded an inflow of $13.19 million last week, marking 12 weeks of continued inflows since early July. If these inflows continue and intensify this week, SOL could extend gains.
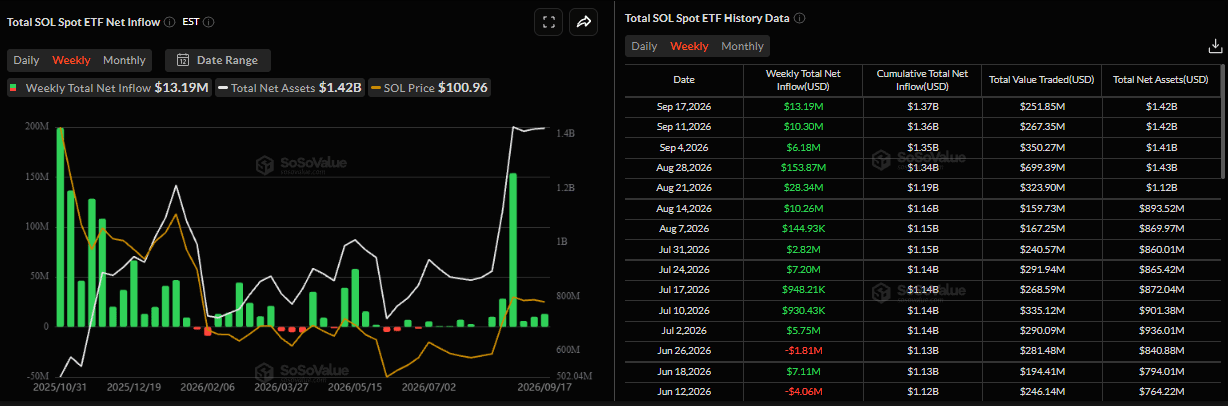
Total SOL spot ETF net inflow weekly chart. Source: SoSoValue

Solana technical outlook: Improving momentum indicators hint at higher highs

Solana price trades at $111.74 on Monday after gaining nearly 12% last week. SOL is maintaining a constructive bullish bias as it holds well above the 50-day, 100-day, and 200-day exponential moving averages (EMAs). The uptrend support line guiding the advance has been tested around the current region, while a firm close above recent highs sustains the broader upward structure. 

Momentum indicators support this stance, with the Relative Strength Index (RSI) hovering in the mid‑60s and the Moving Average Convergence Divergence (MACD) line above the signal line in positive territory, suggesting buyers still retain near‑term control.

On the downside, initial cushioning appears near the immediate pivot zone around $111. A deeper pullback would expose the horizontal support and the 50-day EMA clustered just below $96, ahead of the 200-day EMA near $93 and the 100-day EMA closer to $90. At the same time, a more pronounced correction could revisit the broader structural floor around $77. 

On the topside, bulls are aiming for the $120 mark, where a close above suggests further gains.
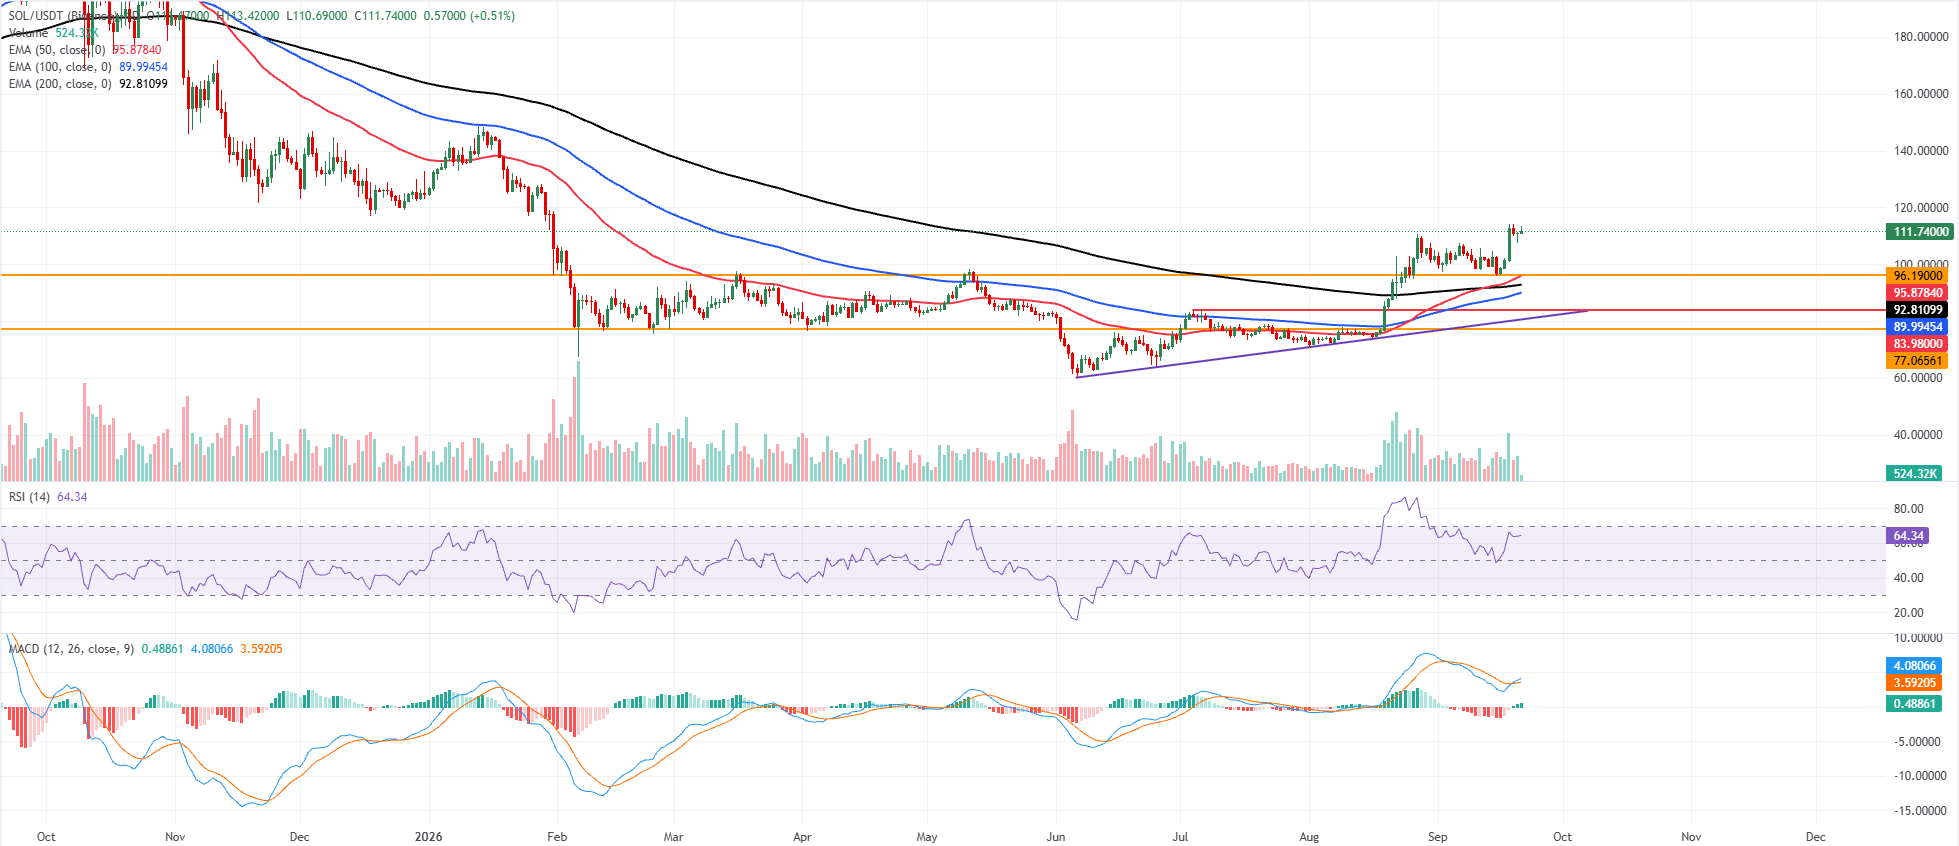
SOL/USDT daily chart

(The technical analysis of this story was written with the help of an AI tool. Know more.)

Disclaimer: For information purposes only. Past performance is not indicative of future results.
placeholder
XRP Price Prediction for July 2026: Can Buyers Finally Break the Downtrend?XRP (XRP) price trades near $1.05, caught between a year-long downtrend and a sudden burst of buying.July has historically rewarded XRP holders. This year the month arrives with on-chain accumulation
Author  Beincrypto
Jun 30, Tue
XRP (XRP) price trades near $1.05, caught between a year-long downtrend and a sudden burst of buying.July has historically rewarded XRP holders. This year the month arrives with on-chain accumulation
placeholder
XAUUSD Gold Analysis: Gold Holds Above $4,350 Ahead of US Inflation Data Is $4,500 Next? Gold holds above $4,350 following weak US jobs data. As inflation reports approach and UBS eyes $5,000, can XAUUSD break resistance at $4,435 to rally toward $4,500?
Author  Naoufal Seddik
Aug 12, Wed
Gold holds above $4,350 following weak US jobs data. As inflation reports approach and UBS eyes $5,000, can XAUUSD break resistance at $4,435 to rally toward $4,500?
placeholder
Gold Price Analysis Today: Gold Drops 1.32% Despite Lower Fed Rate-Hike Bets, Can $4,313 Support Hold? Gold fell 1.32% on August 13 after rising to $4,449.73, then reversing lower and closing near $4,349.918 below the $4,356.46 support. Softer US inflation data reduced Fed rate hike expectations, but selling pressure still dominated the session. Will $4,313 support hold?
Author  Naoufal Seddik
Aug 14, Fri
Gold fell 1.32% on August 13 after rising to $4,449.73, then reversing lower and closing near $4,349.918 below the $4,356.46 support. Softer US inflation data reduced Fed rate hike expectations, but selling pressure still dominated the session. Will $4,313 support hold?
placeholder
Gold Price Analysis Today: Gold Gains 0.94% as Markets Expect Fed to Hold Rates, Can $4,449 Resistance Break? Gold gained 0.94% on August 17, closing near $4,417.30 as softer US data strengthened expectations for unchanged Fed rates in September. Gold remains bullish, with $4,449.730 resistance and $4,310.650 support in focus.
Author  Naoufal Seddik
Aug 18, Tue
Gold gained 0.94% on August 17, closing near $4,417.30 as softer US data strengthened expectations for unchanged Fed rates in September. Gold remains bullish, with $4,449.730 resistance and $4,310.650 support in focus.
placeholder
Gold Price Analysis Today: Gold Rebounds After 1.91% Drop as Yields Ease. Is $4,449 Next? Gold fell about 1.91% on August 18 before producing a strong bullish reaction from the 1-hour demand zone in early August 19 trading. RSI is recovering from oversold conditions, but Supertrend remains bearish as traders await the Fed minutes.
Author  Naoufal Seddik
Aug 19, Wed
Gold fell about 1.91% on August 18 before producing a strong bullish reaction from the 1-hour demand zone in early August 19 trading. RSI is recovering from oversold conditions, but Supertrend remains bearish as traders await the Fed minutes.
Related Instrument
goTop
quote