


Top 3 Price Prediction: Bitcoin, Ethereum, Ripple – BTC extends gains, ETH and XRP advance in uptrend
- Bitcoin extends gains, trading above $81,300 on Monday after rallying more than 5% last week.
- Ethereum climbs above $2,600 after gaining nearly 7% in the previous week.
- XRP holds above the key $1.355 support level and extends its recovery, keeping the focus on further gains.
Bitcoin (BTC), Ethereum (ETH) and Ripple (XRP) extend their gains on Monday after posting strong gains of over 5%, 6% and 5%, respectively, last week. BTC trades above $81,300, ETH climbs above $2,600, and XRP holds above the key $1.300 support level. All three momentum indicators suggest early bullish momentum and hint at further gains ahead.
Bitcoin bulls aim for $85,000 mark
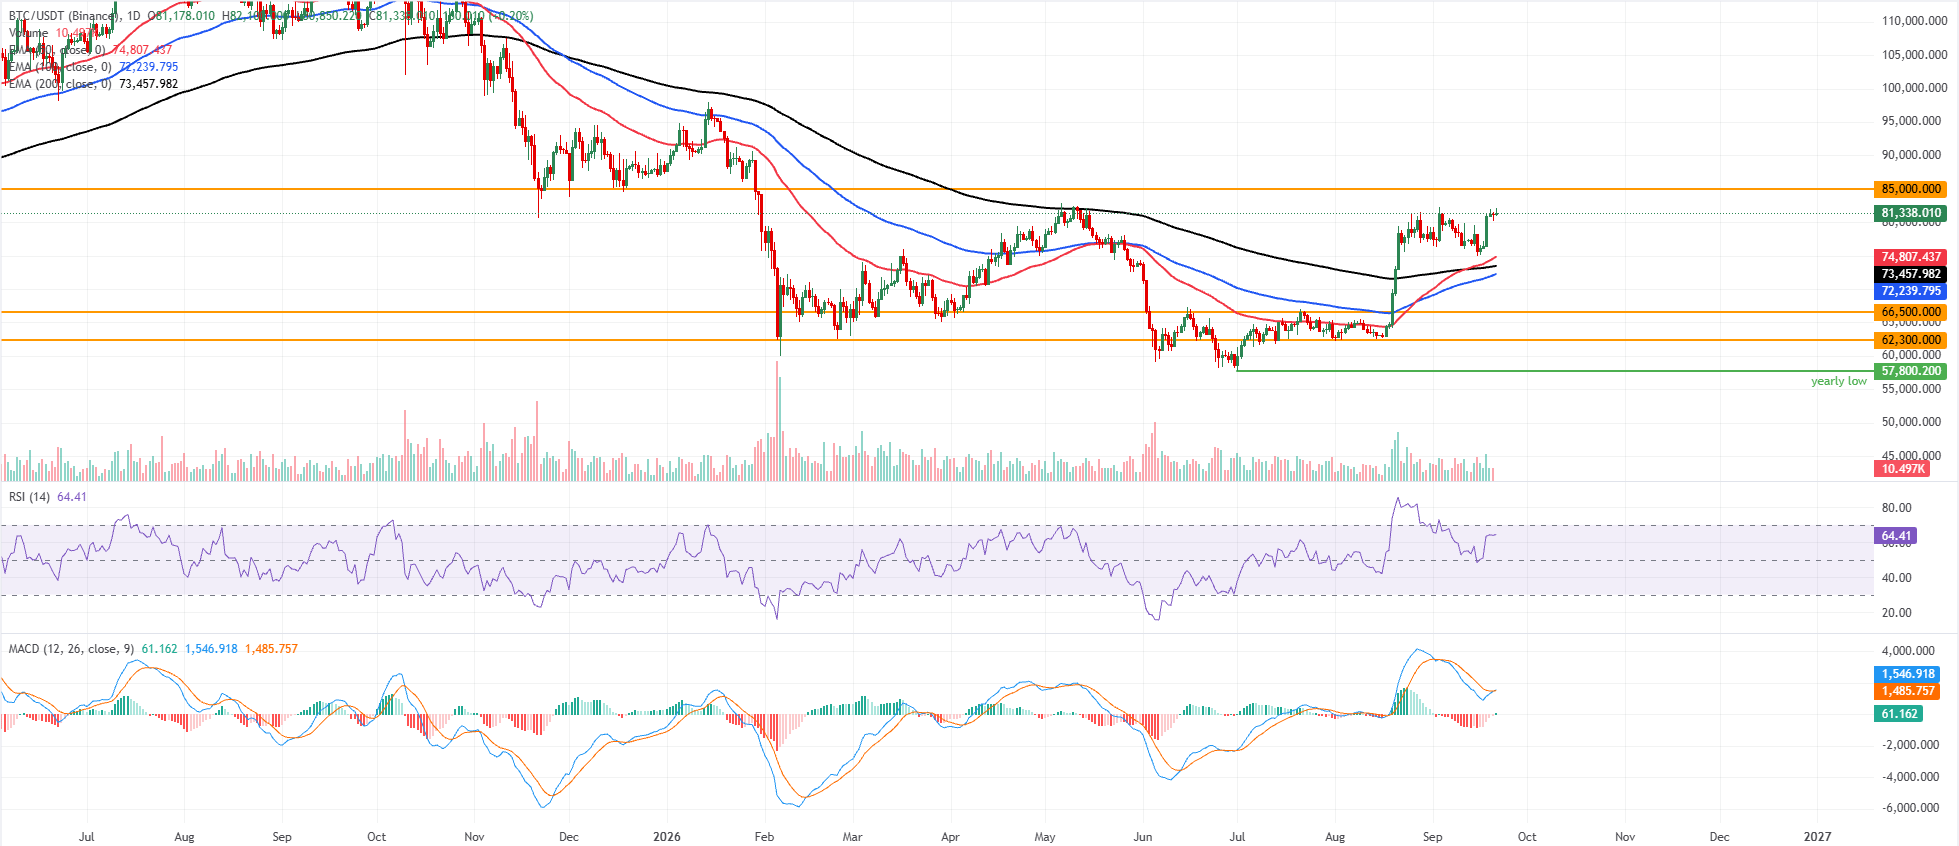
Bitcoin price trades at $81,334 on Monday after gaining over 5% last week. BTC maintains a bullish near-term bias as price holds well above the 50-day, 100-day, and 200-day Exponential Moving Averages (EMAs) clustered between roughly $72,000 and $75,000.
The slope of these EMAs remains positive, with the shorter-term 50-day EMA above the 100- and 200-day EMAs, suggesting the broader uptrend is intact despite recent consolidation. The Relative Strength Index (RSI) at about 64 stays in bullish territory but shy of overbought, while the Moving Average Convergence Divergence (MACD) has turned positive again, hinting that upside momentum is rebuilding after a prior cooling phase.
On the topside, initial resistance is seen at the horizontal barrier near $85,000, where a break would open the door to fresh highs.
On the downside, the 50-day EMA around $74,807 provides immediate support, reinforced by the 200-day EMA near $73,458 and the 100-day EMA near $72,240, which together form a broad demand band on pullbacks. Below that, horizontal cushions emerge at $66,500 and $62,300, levels that would need to give way to challenge the prevailing bullish structure seriously.
Ethereum bulls in control
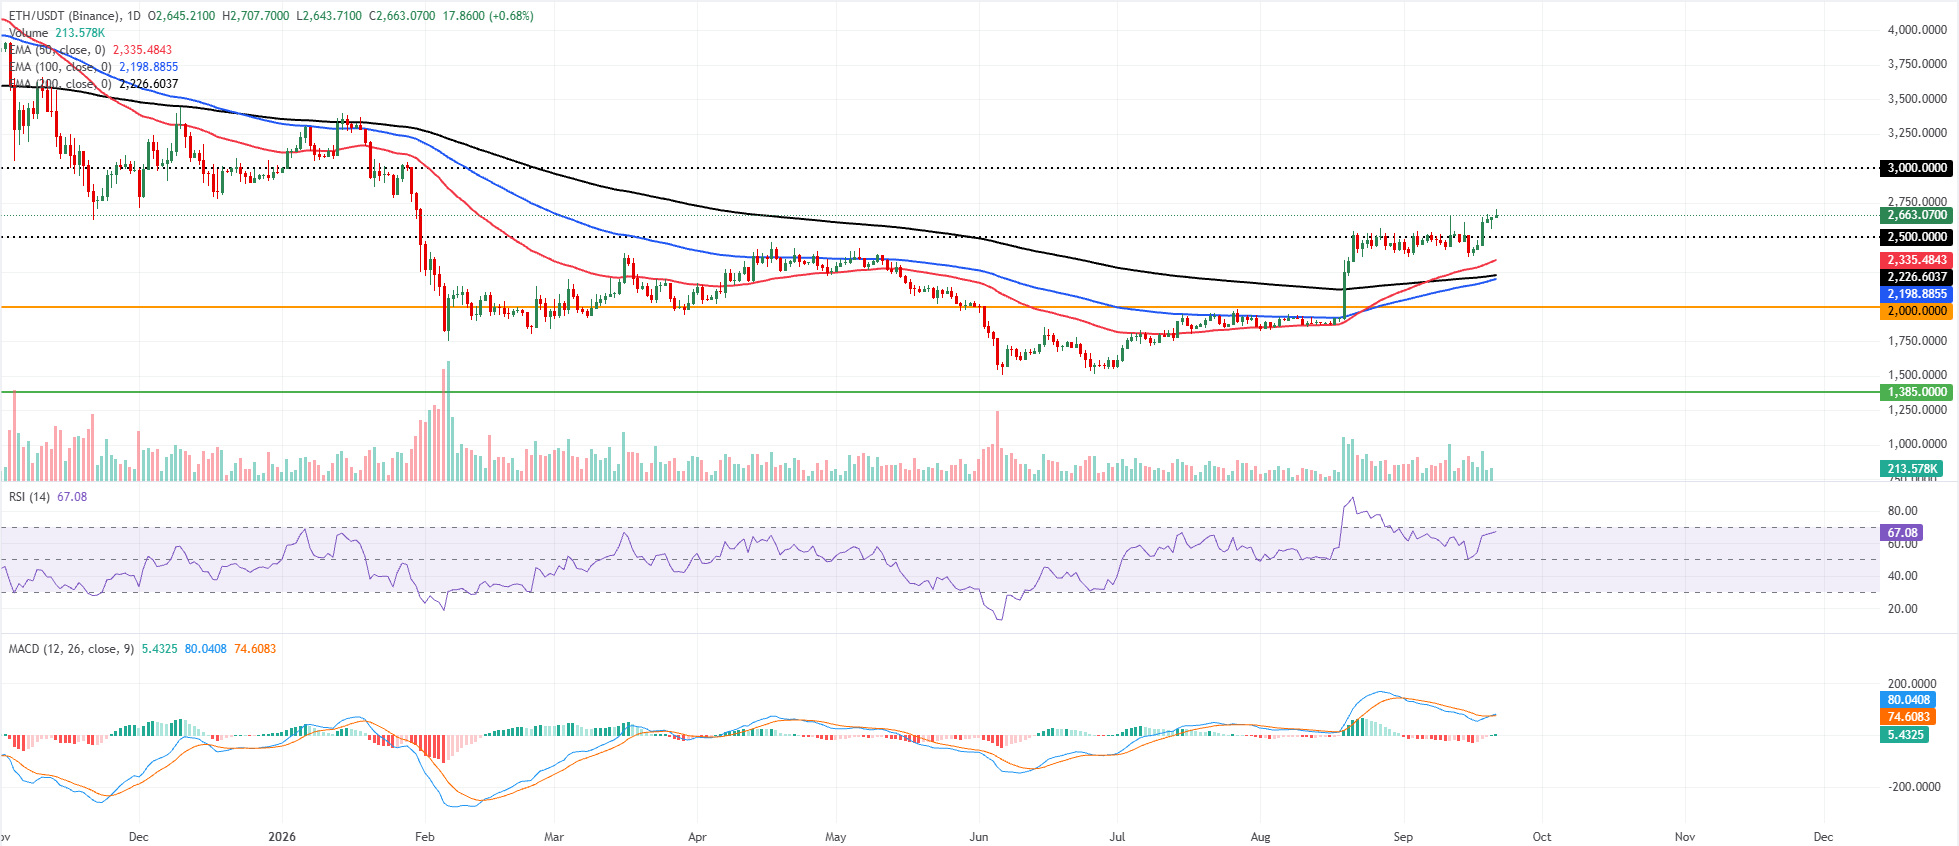
Ethereum price trades at $2,663 on Monday, maintaining a bullish near-term bias as price holds well above the 50-day, 100-day and 200-day EMAs, clustered between roughly $2,200 and $2,335. This stacked EMA structure suggests a firmly supported uptrend. At the same time, the RSI near 67 keeps the market just shy of overbought territory, and the MACD has turned positive, suggesting upside momentum remains intact but is maturing.
On the downside, initial support appears at the recent horizontal level around $2,500, with the 50-day EMA at about $2,335 and the 100-day and 200-day EMAs near $2,198–$2,226 offering a deeper demand zone ahead of the psychological $2,000 handle.
On the topside, the next notable resistance is the horizontal barrier at $3,000, and a daily close above this cap would open the way for further gains. At the same time, failure to clear it could encourage consolidation or a corrective pullback toward the EMA cluster.
XRP’s momentum indicators show fading bearish strength
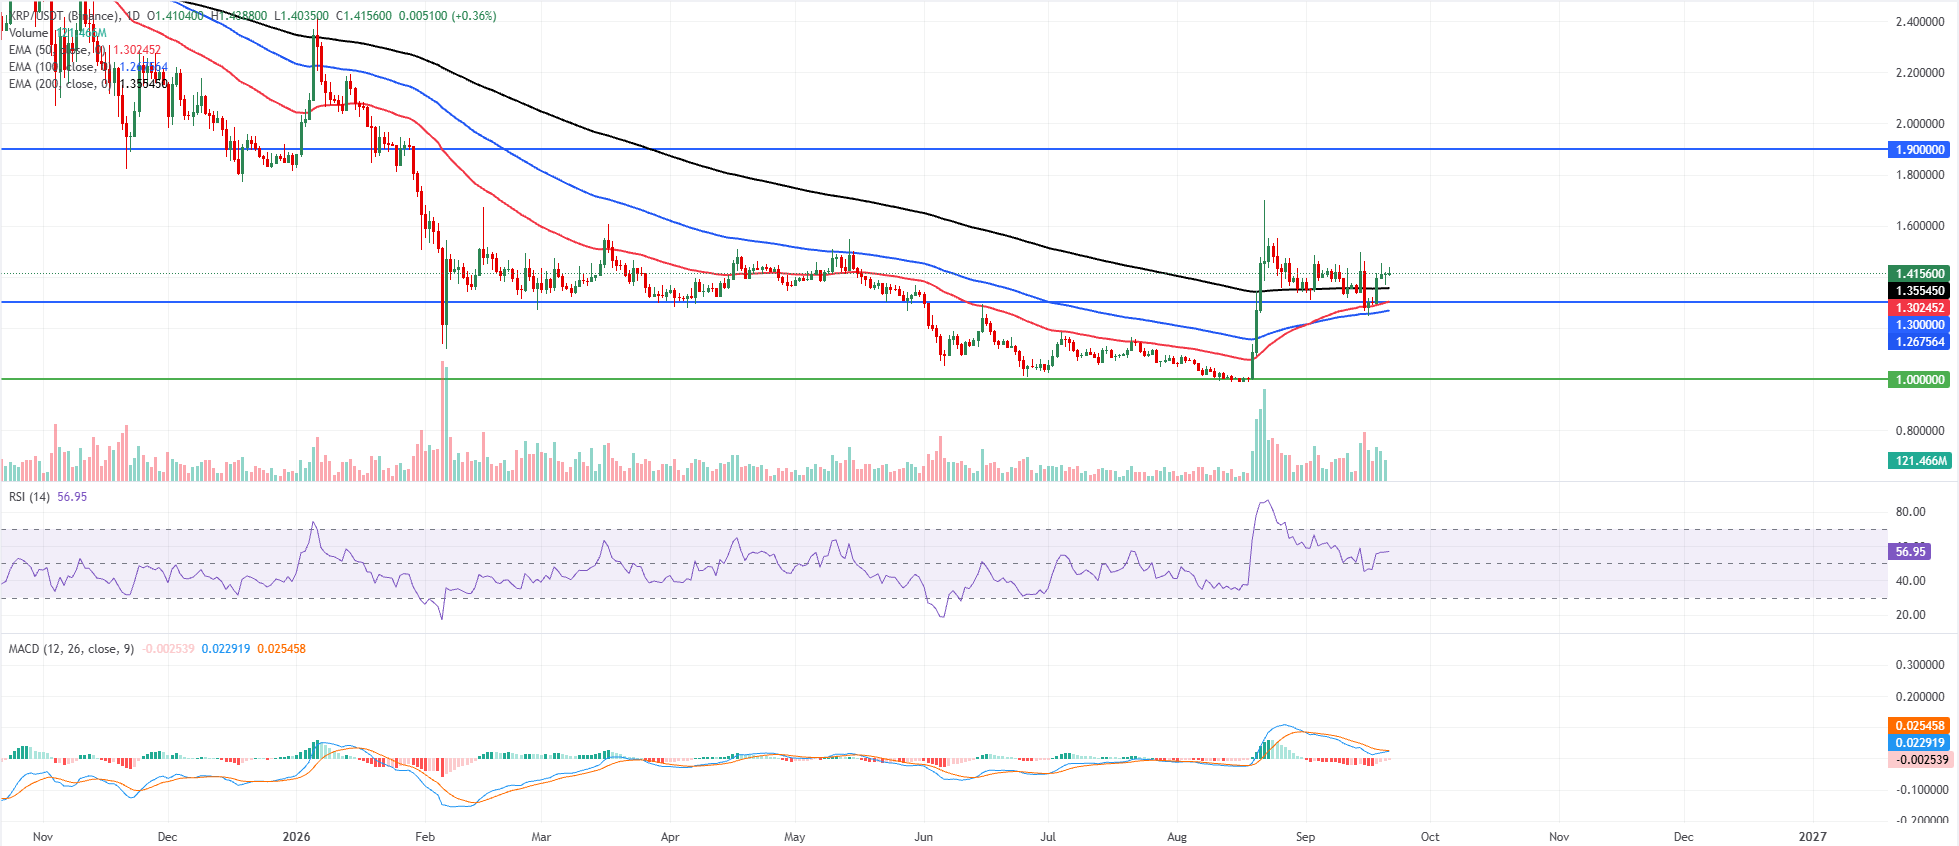
XRP price trades at $1.415 on Monday as it holds above a stacked band of EMAs, with the 50-day EMA near $1.302, the 100-day EMA around $1.267, and the 200-day EMA close to $1.355, suggesting the broader structure remains supported despite recent consolidation.
The Relative Strength Index (RSI) hovers around 56, indicating neutral-to-moderate bullish momentum. At the same time, the Moving Average Convergence Divergence (MACD) line is slightly negative, hinting that upside pressure is firm but not yet impulsive.
On the downside, initial support is seen at the 200-day EMA around $1.355, followed by the 50-day EMA and a horizontal support cluster near $1.302–$1.300, with the 100-day EMA lower at roughly $1.267 and a more distant structural floor at $1.000.
On the topside, the next notable resistance comes at the horizontal level around $1.900, and a daily close above this barrier would be needed to reopen a stronger bullish extension in the near term.
(The technical analysis of this story was written with the help of an AI tool. Know more.)
Recommended Articles


