

Arbitrum Price Forecast: ARB extends rally on “Innovation Exemption” amid rising tokenized funds

Source Fxstreet
  • Arbitrum rallies nearly 30% so far on Friday, surpassing the previous annual high of $0.2277 set on January 6.
  • US SEC issued an “Innovation Exemption” on Thursday, enabling Tokenized Securities Venues to trade tokenized NMS stocks.
  • The tokenized funds on Arbitrum On reached a fresh high of over $900 million, suggesting a steady influx of tokenized RWAs.

Arbitrum (ARB) continues a clear bullish rally, up 28% so far on Friday, approaching the $0.2300 mark. This rally aligns with the US Securities and Exchange Commission (SEC) granting an “Innovation Exemption” on Thursday, a five-year temporary relief for crypto platforms to trade tokenized stocks. Tokenized funds on Arbitrum have surpassed $900 million in value, reaching a new high and indicating elevated demand for tokenized assets.

Tokenized fund flows to Arbitrum amid SEC’s push for tokenized stock trading

The US SEC granted a five-year temporary exemption to Tokenized Securities Venues (TSVs) like Arbitrum to trade tokenized National Market System (NMS) stocks, amid a rise in tokenized funds. This decision enables 24/7 trading of tokenized assets and instant settlement using permissioned AMM liquidity pools. However, TSVs will require auditable smart contracts on public permissionless ledgers and limits on trading volume. 

Arbitrum, an Ethereum-based Layer-2 platform, emerges as a ready infrastructure for tokenized real-world assets (RWAs), aiming to build a programmable economy. Token Terminal data shows a sharp influx of tokenized funds on Arbitrum, reaching a record high of $979.93 million on Wednesday, driven by credit funds, US and Non-US Treasury bills, and yield strategies.
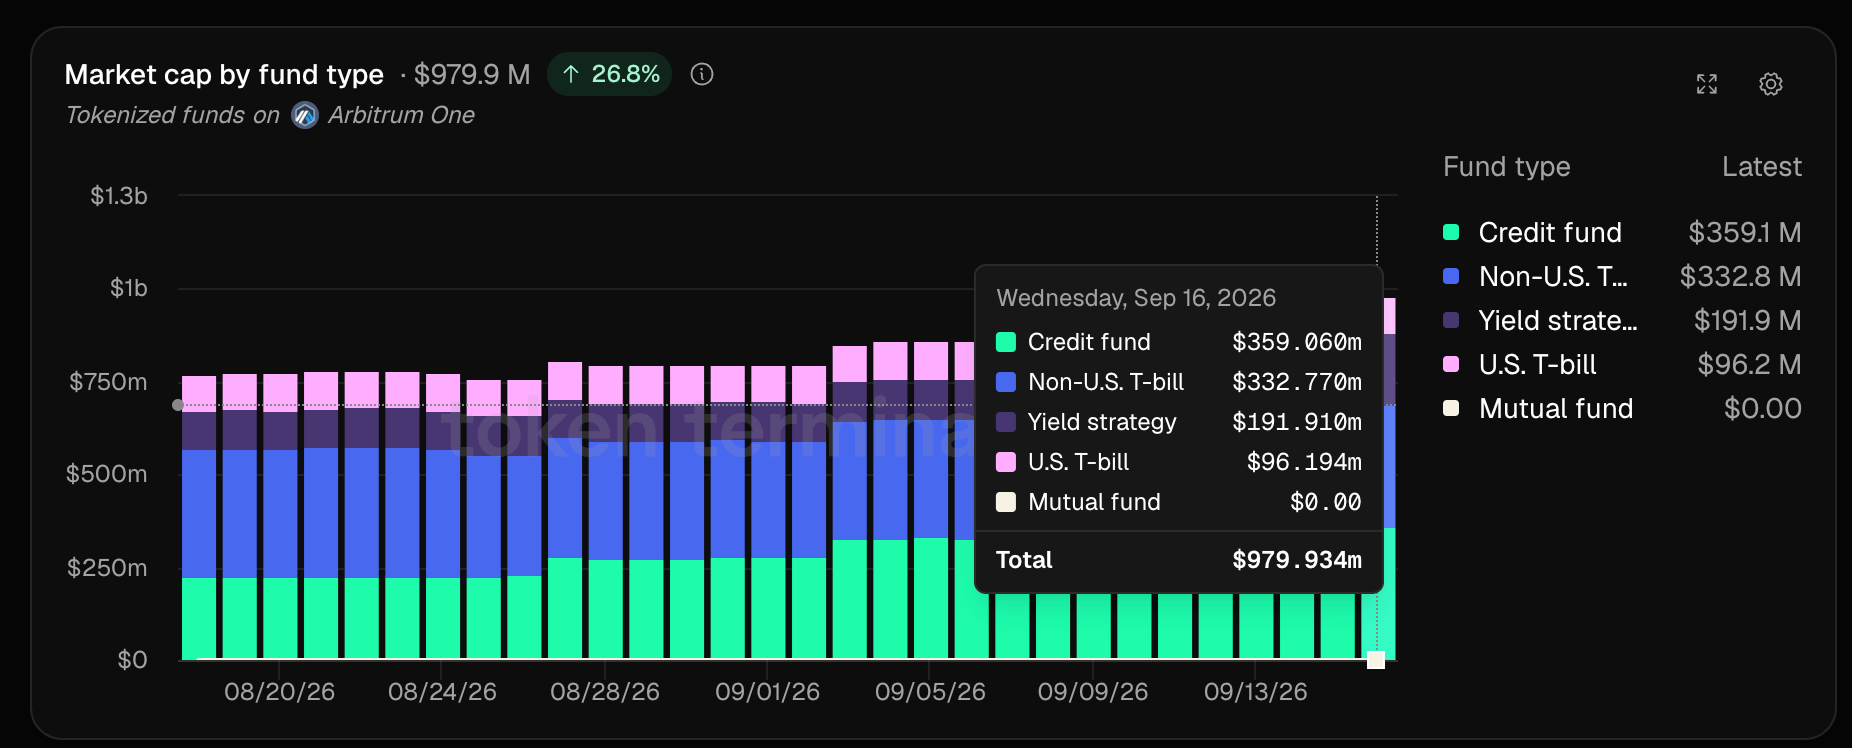
Arbitrum tokenized funds data. Source: Token Terminal

Technical outlook: Arbitrum rally eyes further upside

Arbitrum continues its steady upward rise for the fourth consecutive day, with gains totaling over 70% so far this week. ARB retains a clear bullish near-term bias above the 50-, 100-, and 200-day Exponential Moving Averages (EMAs) at $0.1224, $0.1104, and $0.1236, respectively.

The advance is now pressing into the upper end of the Fibonacci range from $0.2305 to $0.0705, with overhead supply emerging just below the Fibonacci cycle high at the 100% retracement level of $0.2305. A confirmed breakout above this level could target the 127.2% Fibonacci extension level at $0.3181.

Momentum remains constructive, with the Moving Average Convergence Divergence (MACD) crossing above its signal line, while the Relative Strength Index (RSI) rises to 78, flagging overbought conditions.

Chart Analysis ARB/USDT (Binance)
ARB/USDT daily price chart.

On the downside, initial support is seen at the 78.6% Fibonacci retracement at $0.1788, ahead of a deeper corrective floor at the 50% retracement level at $0.1274.

(The technical analysis of this story was written with the help of an AI tool. Know more.)

Disclaimer: For information purposes only. Past performance is not indicative of future results.
placeholder
Will the Tech Rally Continue? The Technical Verdict on the NASDAQ 100 Riding a massive 32% post-earnings wave, the Nasdaq-100 is showing its first signs of exhaustion. We break down crucial exit and entry rules for long positions this week.
Author  Mitrade Team
Jun 05, Fri
Riding a massive 32% post-earnings wave, the Nasdaq-100 is showing its first signs of exhaustion. We break down crucial exit and entry rules for long positions this week.
placeholder
XRP Price Prediction for July 2026: Can Buyers Finally Break the Downtrend?XRP (XRP) price trades near $1.05, caught between a year-long downtrend and a sudden burst of buying.July has historically rewarded XRP holders. This year the month arrives with on-chain accumulation
Author  Beincrypto
Jun 30, Tue
XRP (XRP) price trades near $1.05, caught between a year-long downtrend and a sudden burst of buying.July has historically rewarded XRP holders. This year the month arrives with on-chain accumulation
placeholder
XAUUSD Gold Analysis: Gold Holds Above $4,350 Ahead of US Inflation Data Is $4,500 Next? Gold holds above $4,350 following weak US jobs data. As inflation reports approach and UBS eyes $5,000, can XAUUSD break resistance at $4,435 to rally toward $4,500?
Author  Naoufal Seddik
Aug 12, Wed
Gold holds above $4,350 following weak US jobs data. As inflation reports approach and UBS eyes $5,000, can XAUUSD break resistance at $4,435 to rally toward $4,500?
placeholder
Gold Price Analysis Today: Gold Drops 1.32% Despite Lower Fed Rate-Hike Bets, Can $4,313 Support Hold? Gold fell 1.32% on August 13 after rising to $4,449.73, then reversing lower and closing near $4,349.918 below the $4,356.46 support. Softer US inflation data reduced Fed rate hike expectations, but selling pressure still dominated the session. Will $4,313 support hold?
Author  Naoufal Seddik
Aug 14, Fri
Gold fell 1.32% on August 13 after rising to $4,449.73, then reversing lower and closing near $4,349.918 below the $4,356.46 support. Softer US inflation data reduced Fed rate hike expectations, but selling pressure still dominated the session. Will $4,313 support hold?
placeholder
Gold Price Analysis Today: Gold Gains 0.94% as Markets Expect Fed to Hold Rates, Can $4,449 Resistance Break? Gold gained 0.94% on August 17, closing near $4,417.30 as softer US data strengthened expectations for unchanged Fed rates in September. Gold remains bullish, with $4,449.730 resistance and $4,310.650 support in focus.
Author  Naoufal Seddik
Aug 18, Tue
Gold gained 0.94% on August 17, closing near $4,417.30 as softer US data strengthened expectations for unchanged Fed rates in September. Gold remains bullish, with $4,449.730 resistance and $4,310.650 support in focus.
goTop
quote