


Zcash Price Forecast: ZEC eyes $1,500 breakout as retail demand expands
- Zcash tags a new all-time high above $1,480 as bulls aim for a breakout beyond $1,500.
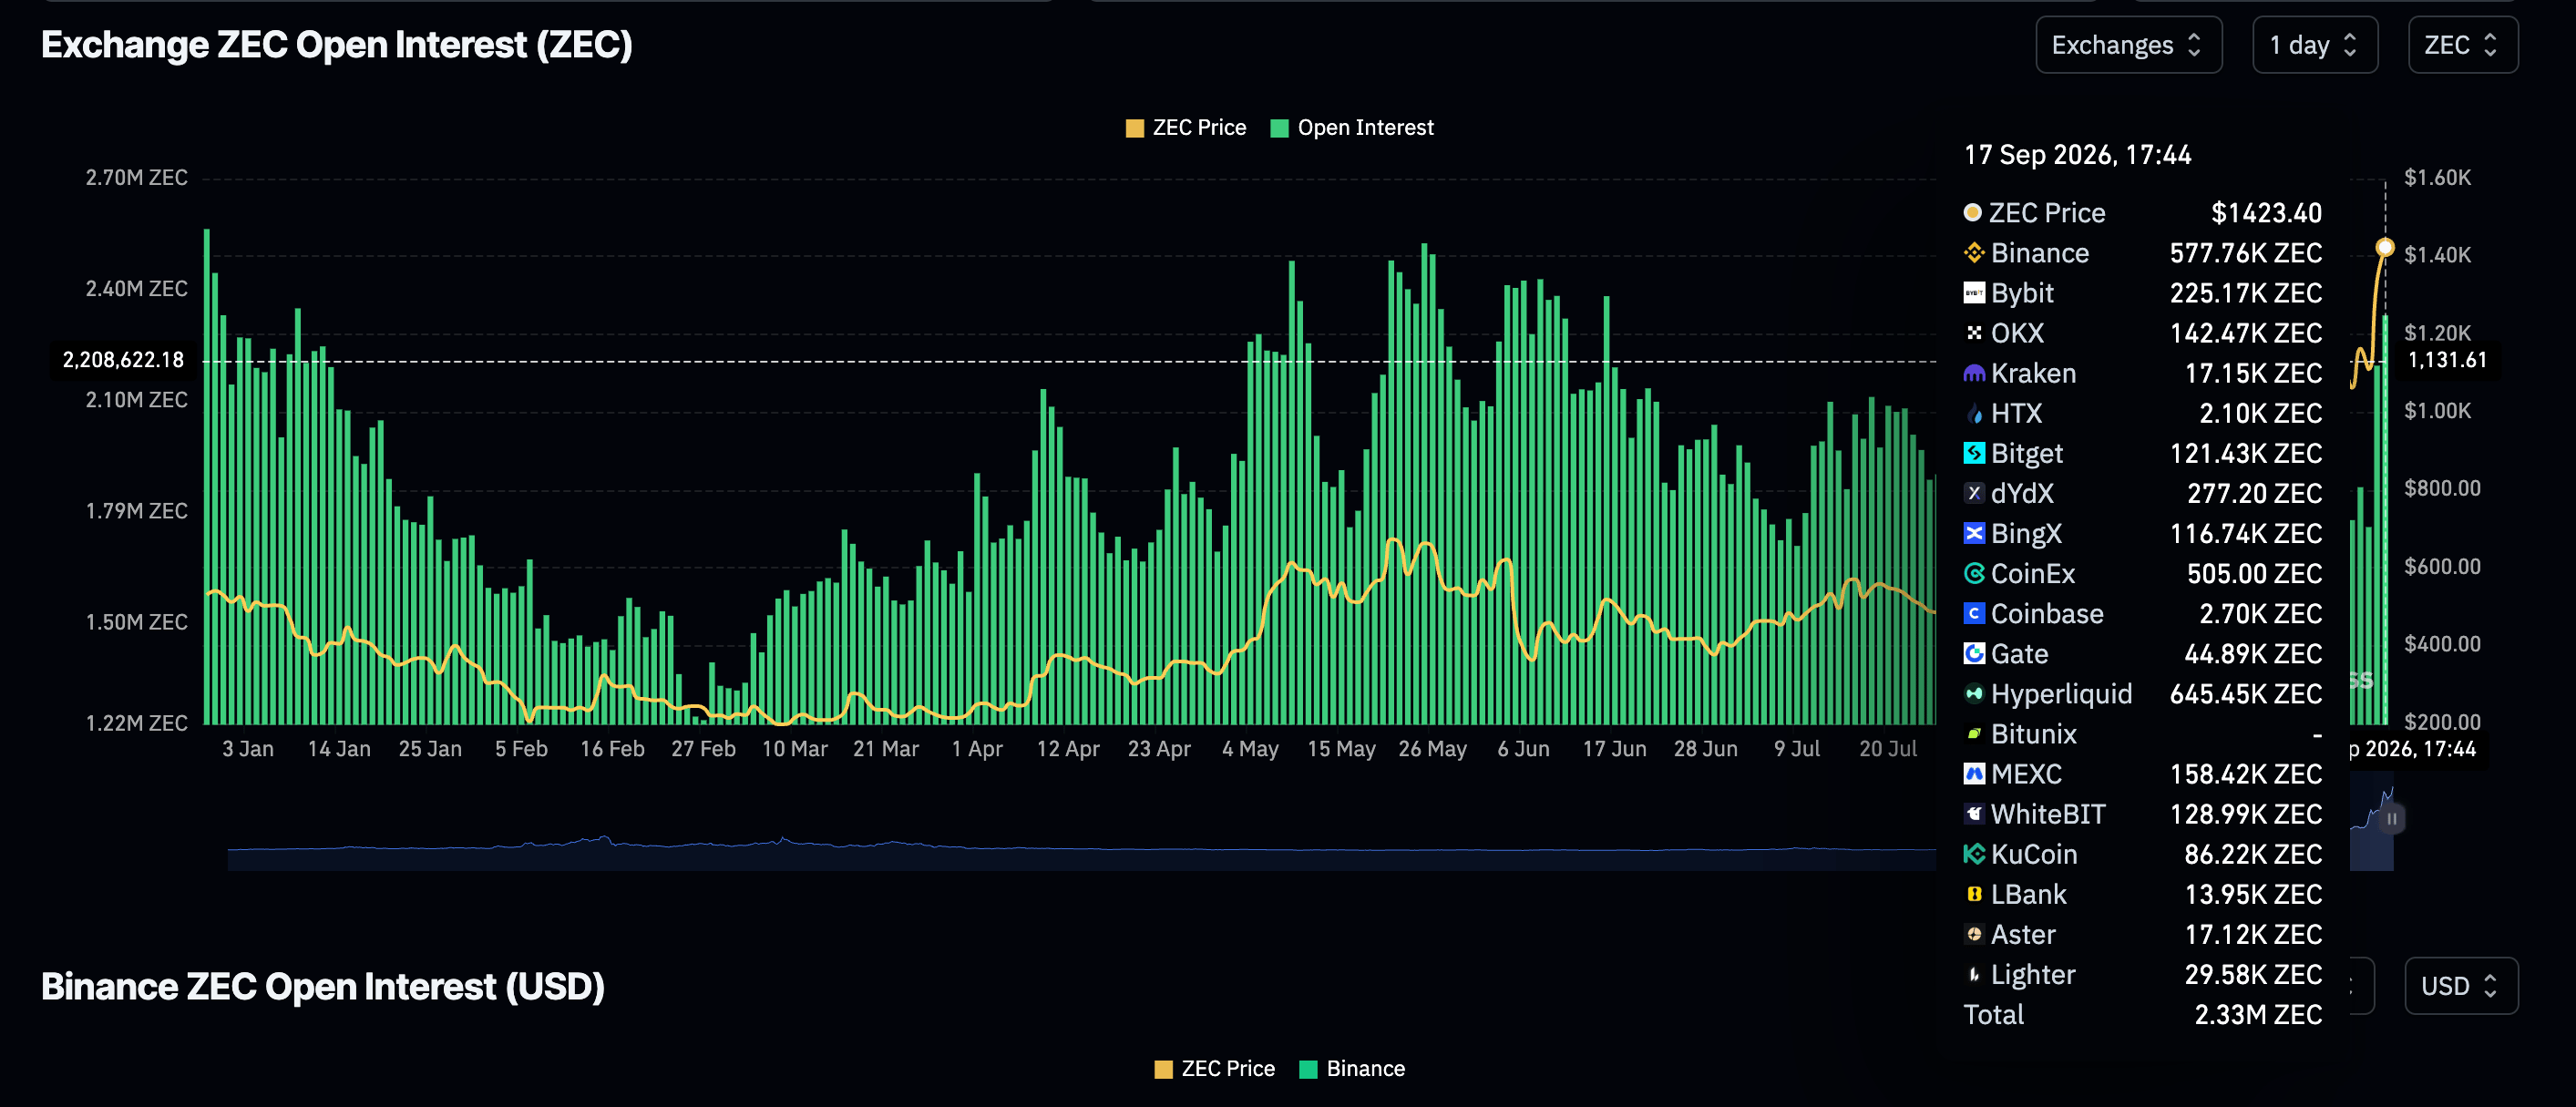
- Zcash’s bullish outlook is supported by growing retail demand, with futures Open Interest climbing to 2.3 million ZEC.
- Momentum indicators highlight a potentially overstretched trend, with the RSI extremely overbought.
Zcash (ZEC) rises sharply above $1,400 on Thursday as the privacy-focused token defies the broader cryptocurrency market's doldrums this week, driven primarily by macro uncertainty and regulatory headwinds.
ZEC’s bullish outlook, though seemingly overextended, remains stable, supported by growing retail demand reflected in the derivatives market. Higher support would reinforce the bullish picture, while a correction from the record high of $1,444 could prompt profit-taking and push the price lower.
Zcash sees steady retail interest
Retail investors continue to support Zcash, as perpetual futures Open Interest (OI) rose to 2.3 million ZEC on Thursday, up from 1.76 million ZEC the day before. The latter marked the lowest level since August 10, underscoring strong retail support. A sustained increase in the OI could raise the odds of a short-term breakout above $1,500.
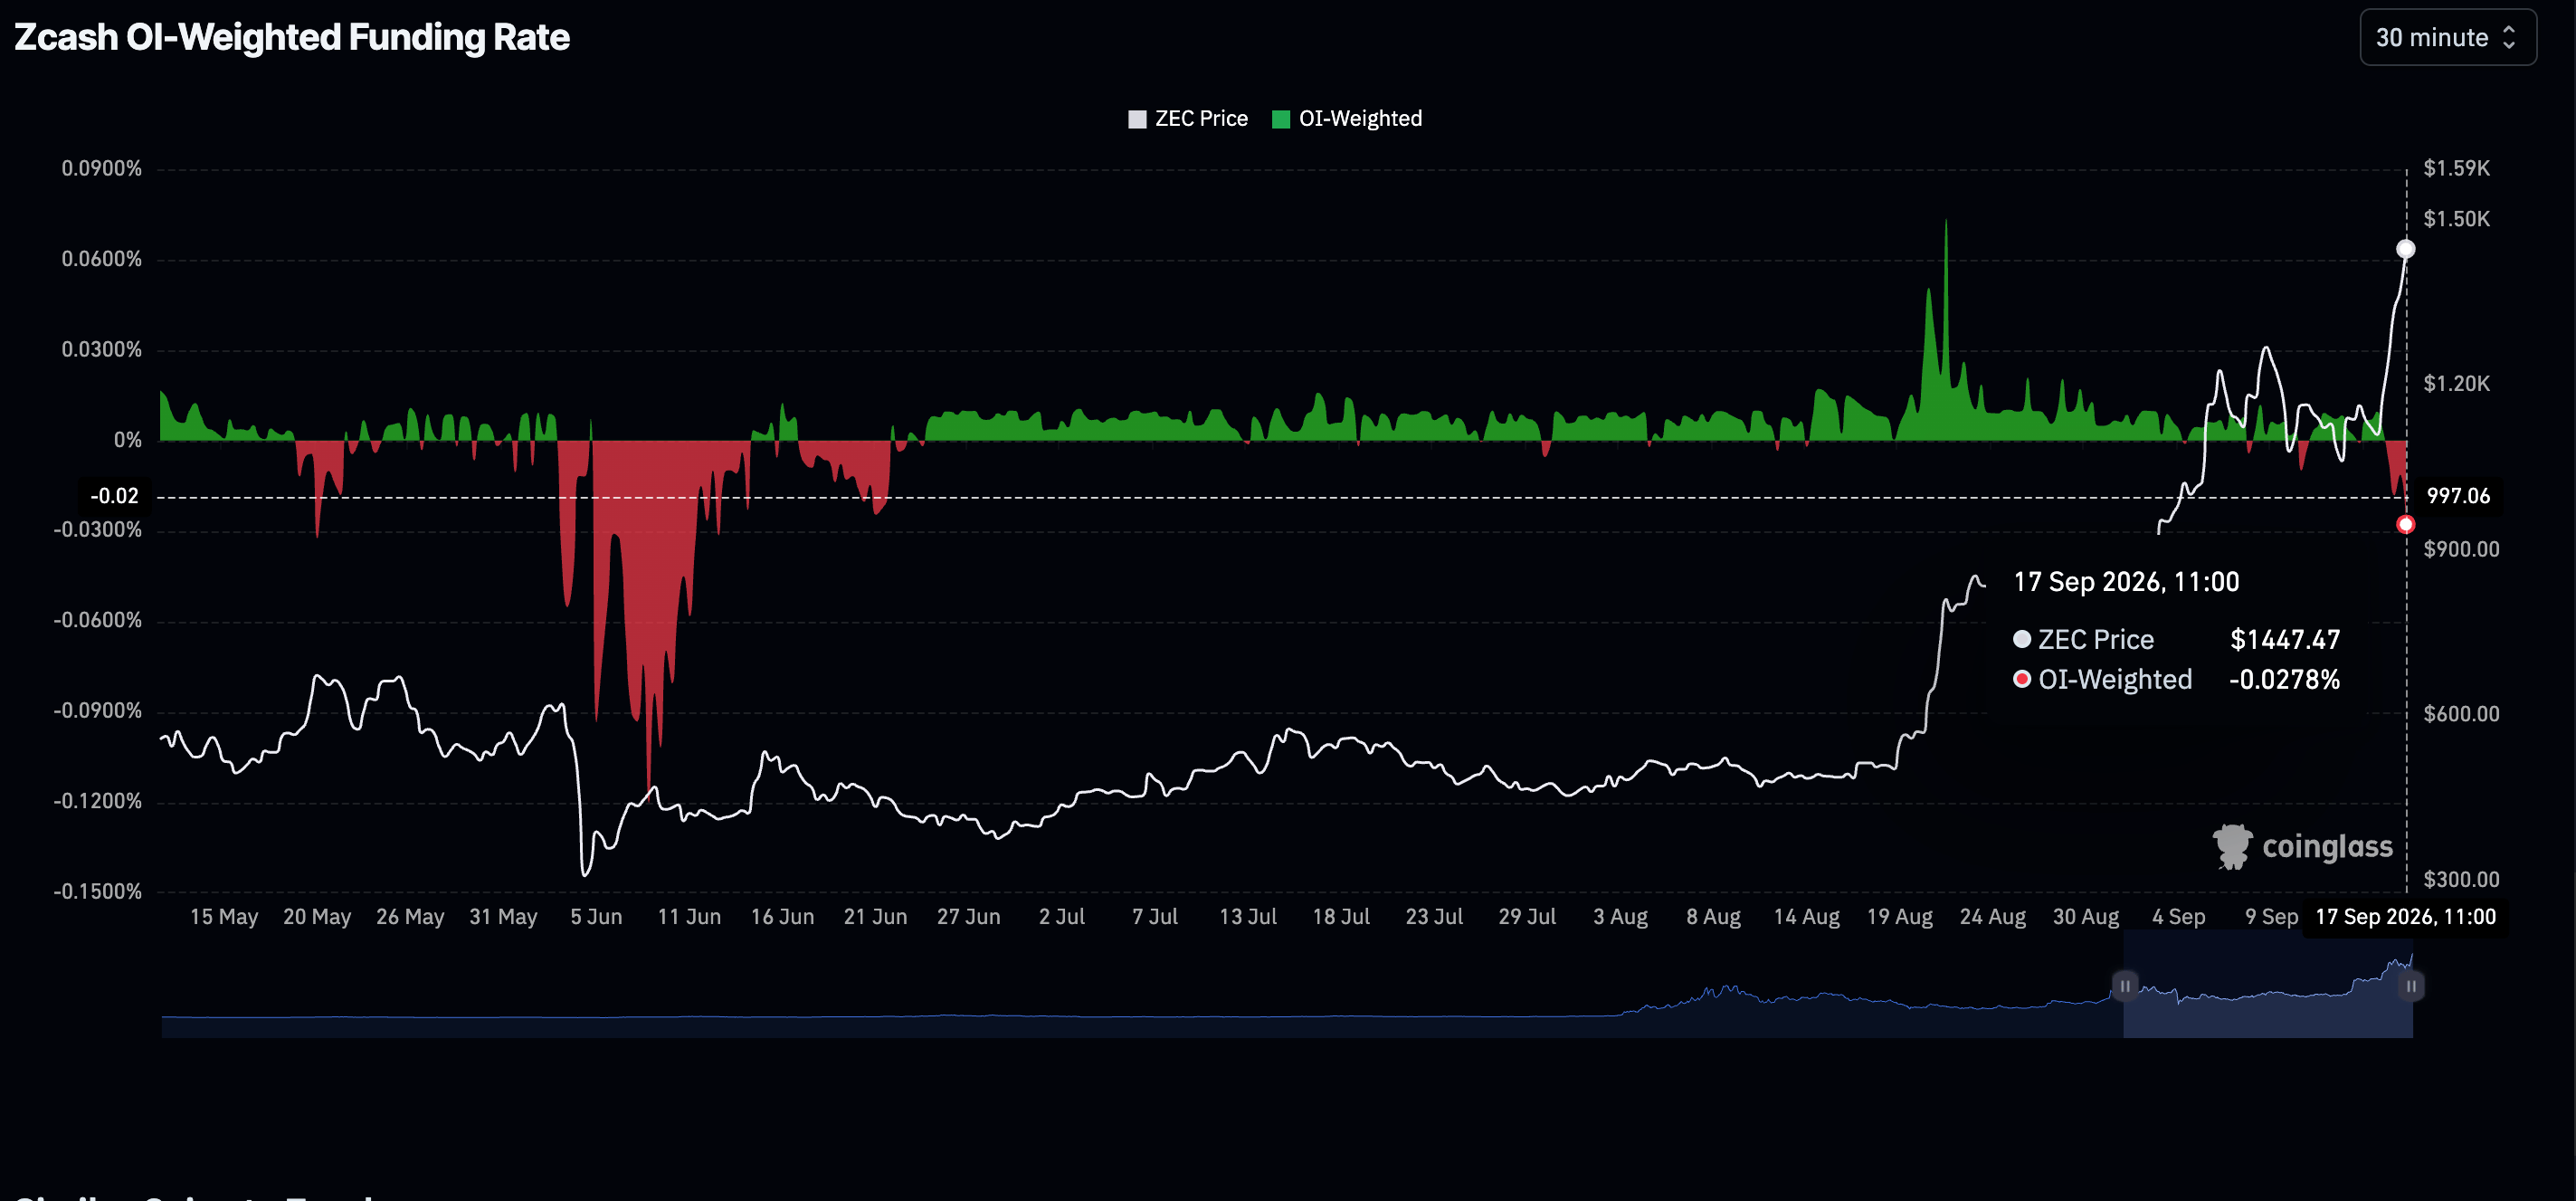
Zcash OI-Weighted Funding Rate has flipped negative for nearly two days, suggesting that bulls are no longer willing to pay a premium in fees to keep their positions open. Therefore, traders should temper expectations because any rejection could accelerate pullbacks toward psychological and structural support levels at $1,200 and $1,000, respectively.
Technical analysis: ZEC extends bullish leg
ZEC trades above $1,400, extending a strong bullish tone as the spot price stands well above the 50-day, 100-day, and 200-day Exponential Moving Averages (EMAs) at $869, $710, and $571, respectively, and above the SuperTrend support trailing at $1,005.
The Relative Strength Index (RSI) at 71 remains in overbought territory, while the Moving Average Convergence Divergence (MACD) stays positive, suggesting continued upward momentum but hinting at a rising risk of a corrective pause.
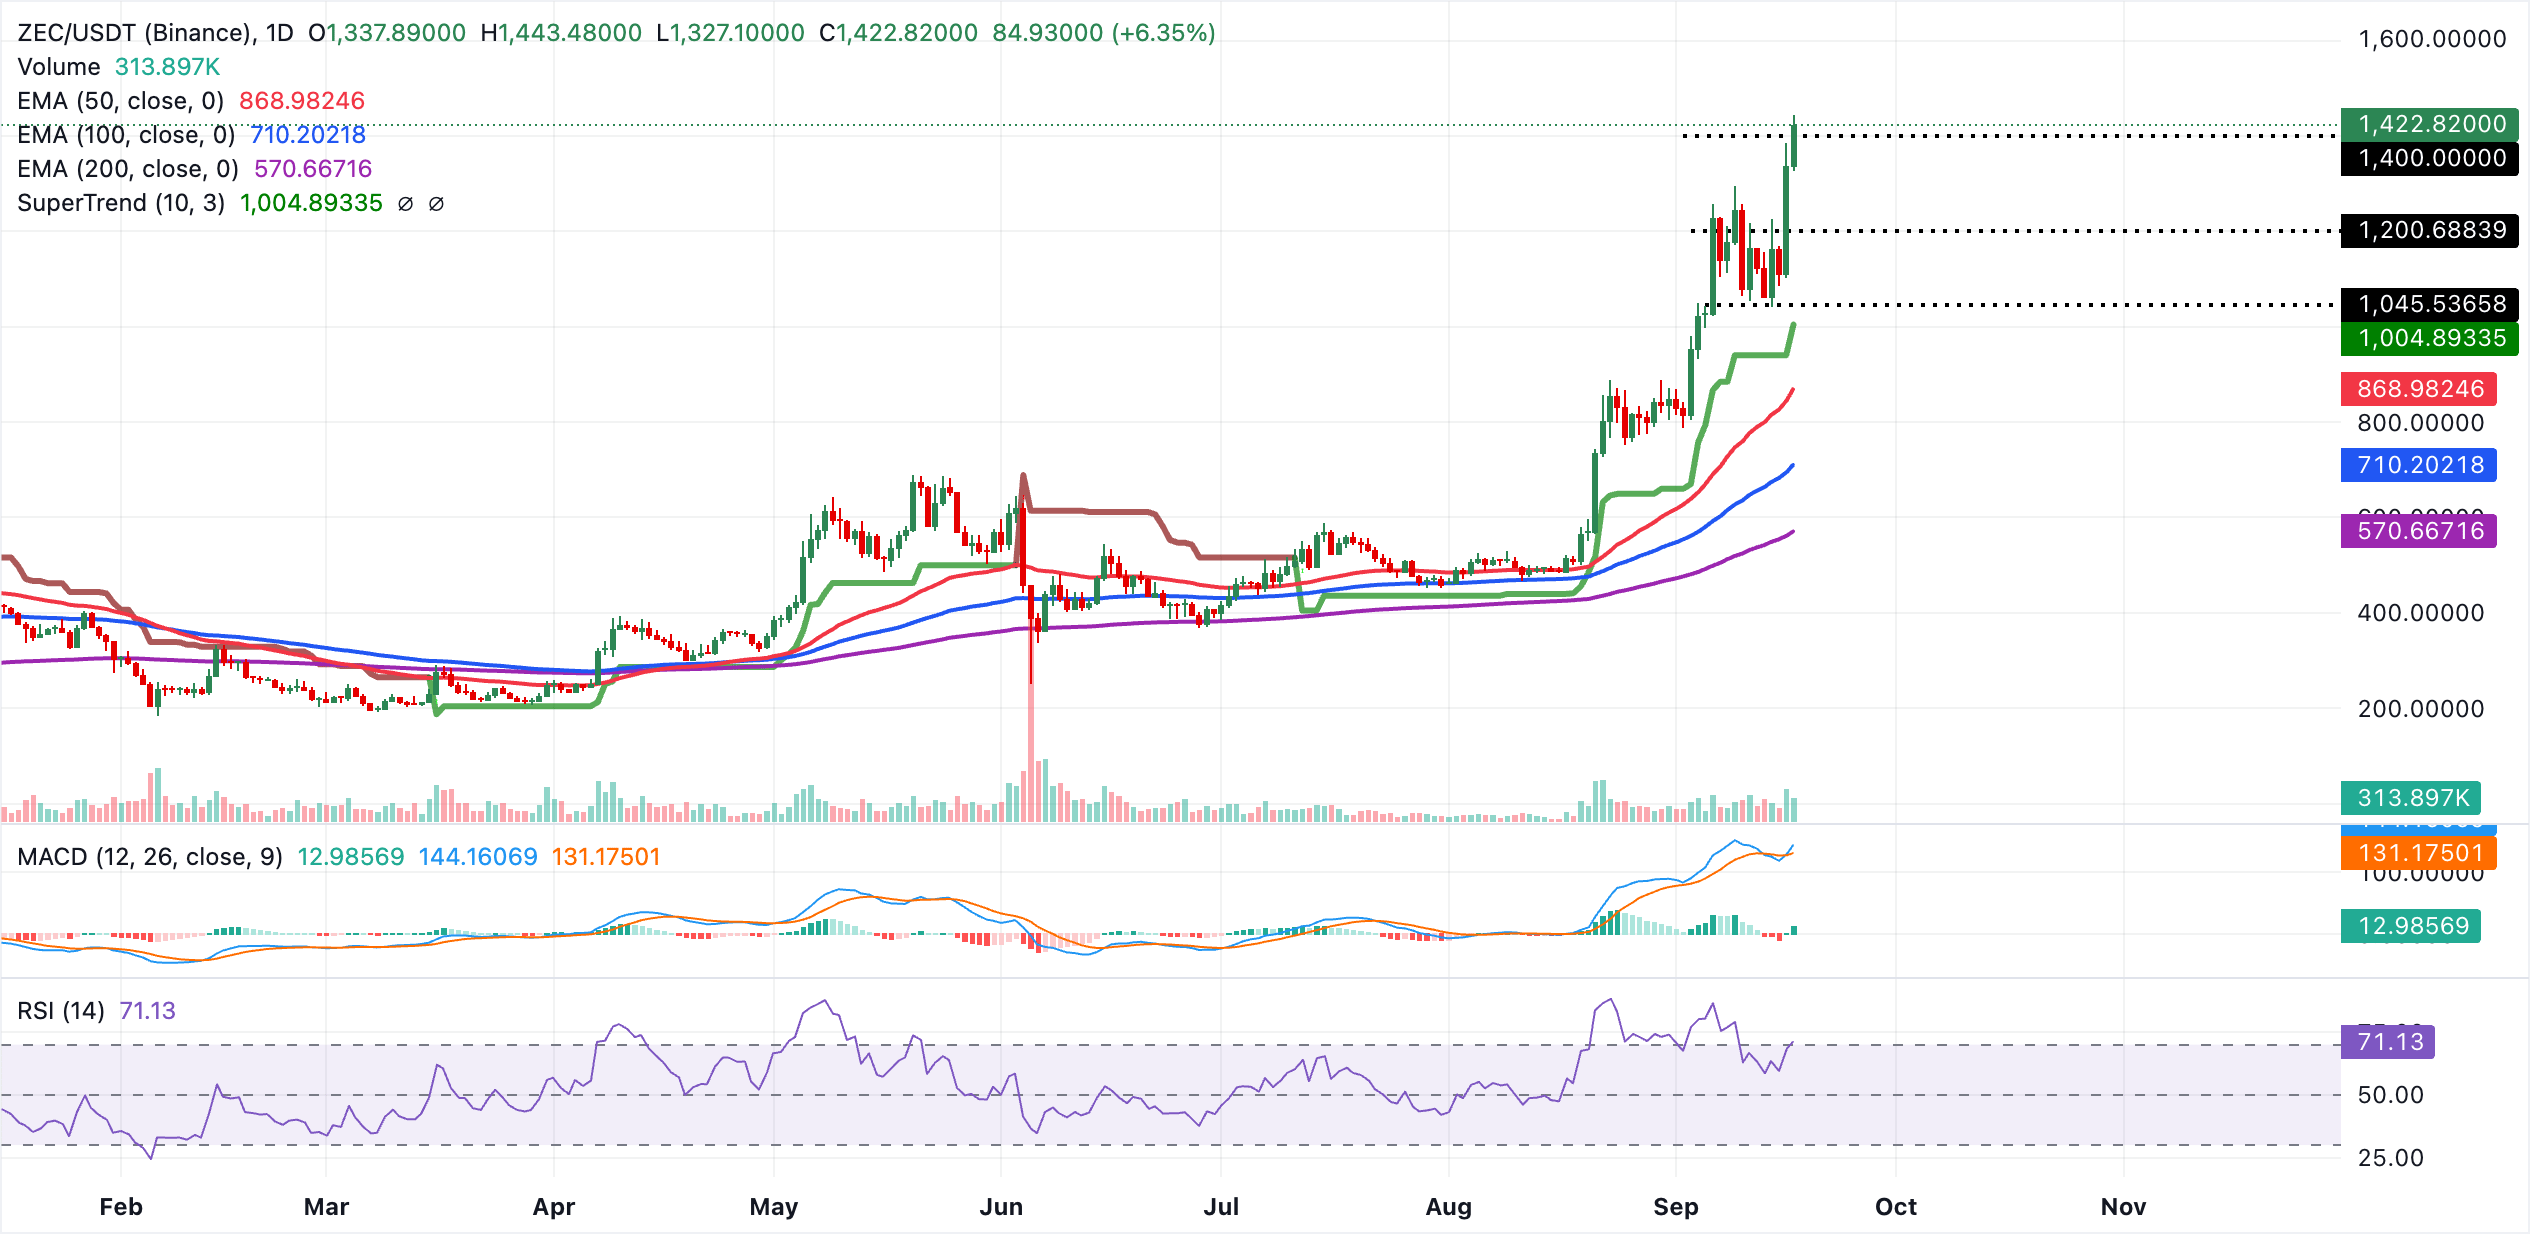
Immediate support lies at key psychological levels such as $1,400 and $1,200, which should act as the first major cushion on any deeper pullback, followed by a structural cluster formed by the SuperTrend line at $1,005 and the 100-day and 200-day EMA demand at $710 and $571. With no nearby overhead technical resistance levels on the daily chart, the pair would remain biased higher as long as it holds above these underlying demand zones. However, the overbought RSI warns that fresh buying could become more selective at these elevated levels.
(The technical analysis of this story was written with the help of an AI tool. Know more.)
Open Interest, funding rate FAQs
Higher Open Interest is associated with higher liquidity and new capital inflow to the market. This is considered the equivalent of increase in efficiency and the ongoing trend continues. When Open Interest decreases, it is considered a sign of liquidation in the market, investors are leaving and the overall demand for an asset is on a decline, fueling a bearish sentiment among investors.
Funding fees bridge the difference between spot prices and prices of futures contracts of an asset by increasing liquidation risks faced by traders. A consistently high and positive funding rate implies there is a bullish sentiment among market participants and there is an expectation of a price hike. A consistently negative funding rate for an asset implies a bearish sentiment, indicating that traders expect the cryptocurrency’s price to fall and a bearish trend reversal is likely to occur.
Recommended Articles


