


Bitcoin slips below $76.7K True Market Mean amid weak demand — Glassnode
- Bitcoin fell below the $76,700 True Market Mean, with $71,300 as the next key on-chain cost basis below current prices.
- BTC’s Realized Cap ended a 27-day streak of inflows, while US spot ETFs recorded $334 million in outflows last week.
- The median top-100 altcoin declined two percentage points more, while the share above their 20-day moving average fell to 19%.
Bitcoin (BTC) has slipped below its recent trading range and the True Market Mean at $76,700, but the top crypto has remained relatively resilient despite a failed Clarity Act Senate vote, FOMC rate hike and a broader altcoin sell-off.
Bitcoin drops below True Market Mean amid weak capital inflows
BTC's decline placed the top crypto 1% below the True Market Mean, which represents the average price paid by active investors, according to a Wednesday report from Glassnode.
Glassnode noted that Bitcoin briefly moved below the level on August 23 and September 10 before recovering, but closed below it on Tuesday following the Senate vote on the CLARITY Act.
“The next cost basis down is the Short-Term Holder Cost Basis at $71.3K, the average price paid for coins bought in the last five months,” Glassnode wrote.
The decline is accompanied by a slowdown in new capital entering the Bitcoin market. Bitcoin’s Realized Cap increased for 27 consecutive days through September 14. That streak ended on Tuesday, when the metric recorded its first outflow in 28 days.
However, exchange activity has not shown the same reversal. Bitcoin held on exchanges continues to decline, with the 30-day Exchange Net Position Change remaining negative.
US spot crypto ETFs have also weakened. The products recorded approximately $334 million in net outflows between September 8 and 14, after attracting nearly $1 billion during the first days of September.
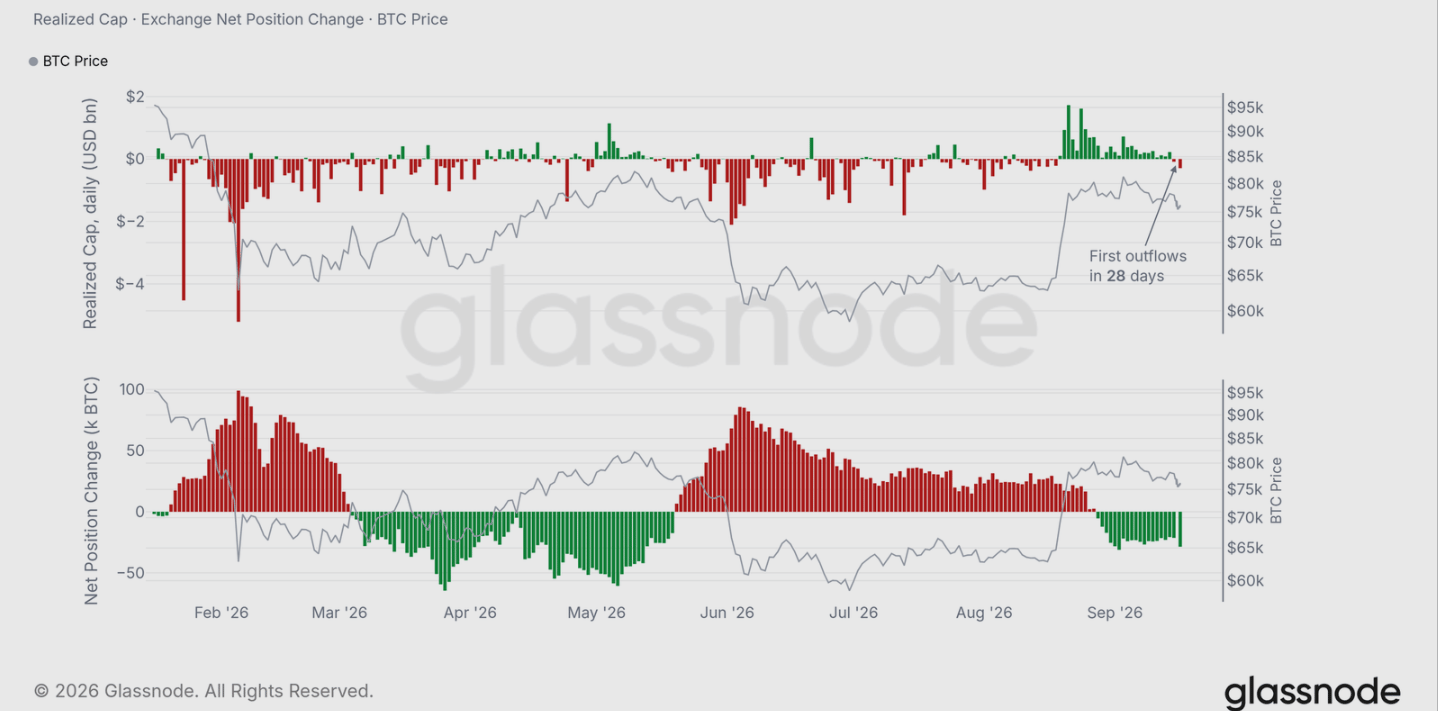
“A return to positive daily Realized Cap changes would say the buyers are back; a run of outflows while price sits under the mean would mean the range's buyers have started to give up,” the report stated.
Stablecoin supply stalls as treasury buying dips further
Stablecoin liquidity is also growing slowly. Total stablecoin market capitalization stands at approximately $306 billion, flat over the week and around 4% below its April 2026 peak.
The report noted that stablecoin supply has recovered from the negative growth recorded during the summer but has not established a new high in five months.
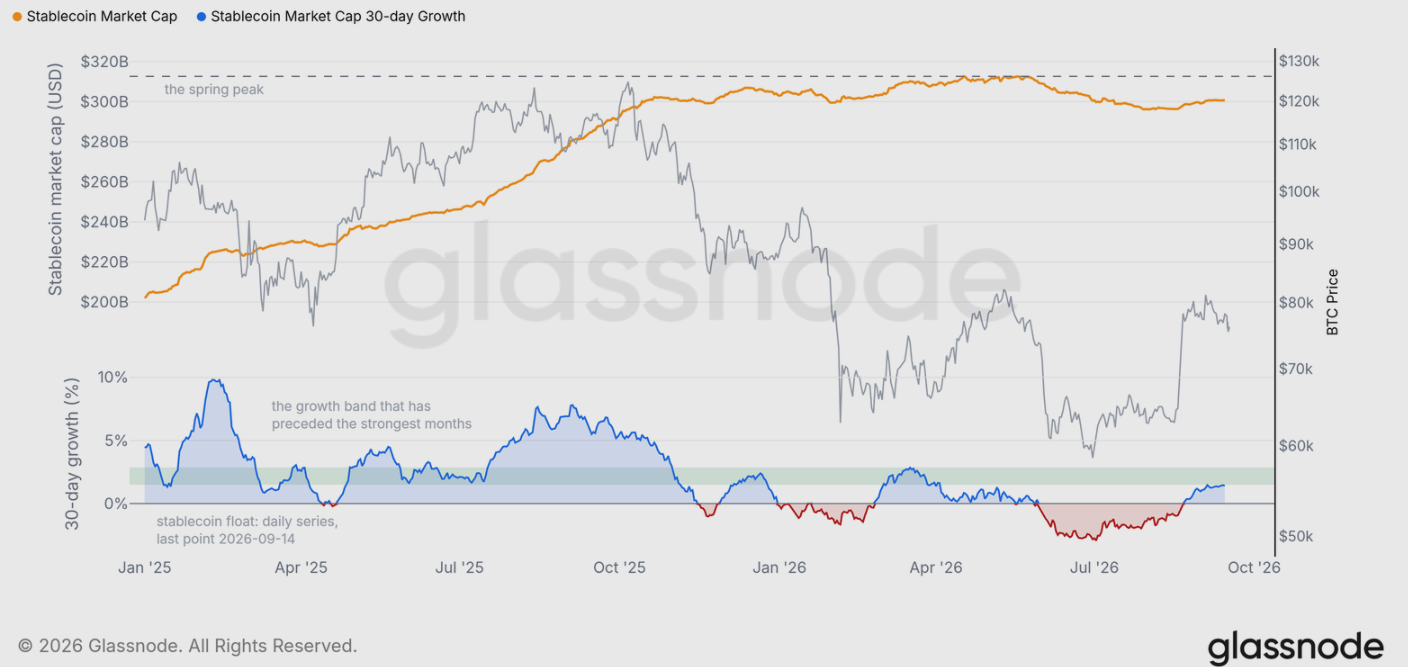
“A breakout needs new dollars, and the supply has not made a new high in five months,” Glassnode wrote.
Corporate treasury purchases have also declined sharply compared with 2025. Listed companies accumulated approximately 5,900 BTC over the past three months, compared with 89,000 BTC purchased in July 2025 alone.
The Corporate Treasury Cost Basis currently stands at $80,500, around 6% above Bitcoin’s latest price. BTC has tested that level twice since falling below it in January, including on September 3, but has been rejected both times.
Altcoins have fallen more sharply than Bitcoin following the Senate vote. Glassnode stated that the median top-100 cryptocurrency fell roughly two percentage points more than BTC, while the share of the top 100 trading above their 20-day moving average dropped from 56% to 19% in one session.
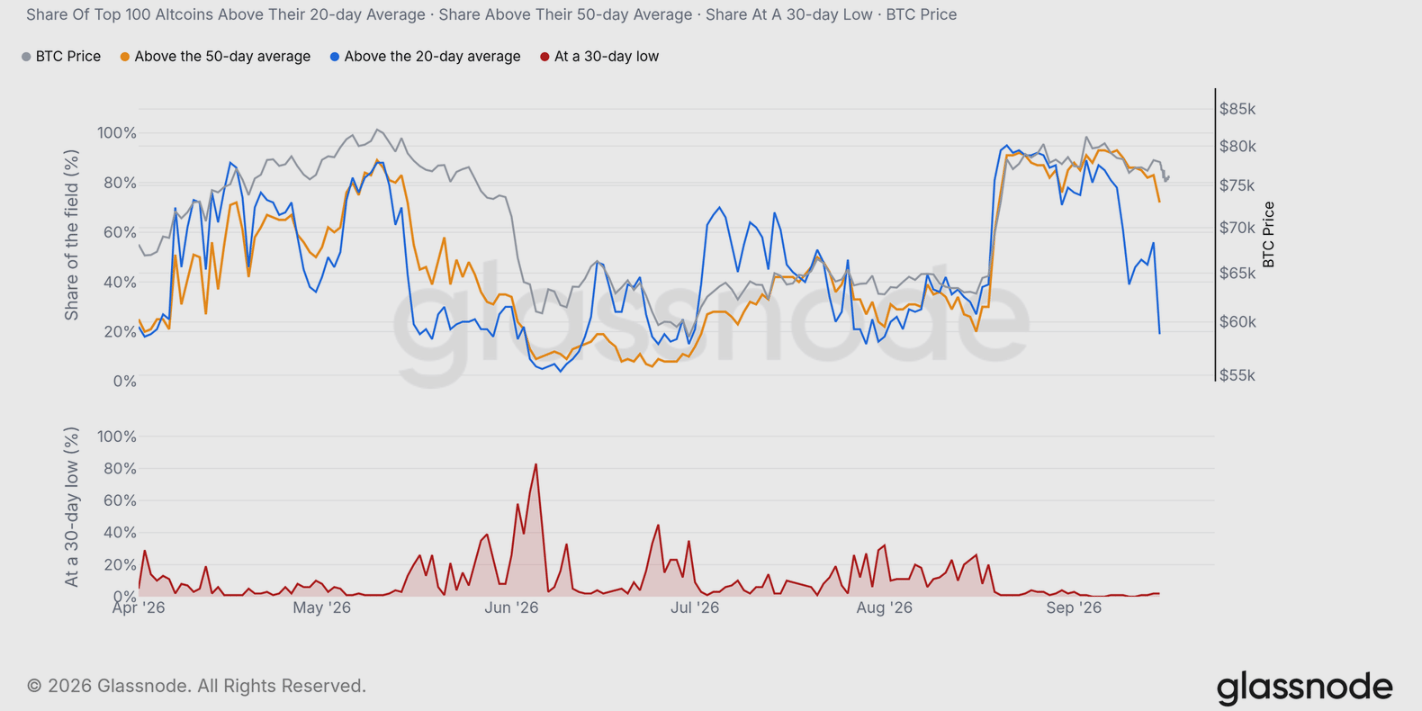
However, the longer-term trend has not yet deteriorated to the same extent. Most top-100 assets remain above their 50-day moving averages, while very few have reached 30-day lows.
Bitcoin is trading at $76,148, up 0.3% in the past 24 hours at the time of writing.
Recommended Articles


