


Bitcoin & Gold Outlook: BTC and XAU correct as US Nonfarm Payrolls rise by 162K in August
- Bitcoin trims gains and trades below $80,000, hinting at increased profit-taking.
- Gold edges lower and tests $4,400, while a major EMA cluster provides additional support.
- US Nonfarm Payrolls rise by 162K in August, surpassing the market expectation of 56K by a broad margin.
Bitcoin (BTC) is back below $80,000 at the time of writing on Friday, after an earlier rejection near $81,500. The largest cryptocurrency by market capitalization aims for short-term support at $79,000, which could encourage dip buying.
Gold (XAU/USD), meanwhile, is trading amid growing headwinds, with the price now testing support at $4,400. The metal surged to $4,511 on Thursday, aligning with positive market sentiment as the United States (US) Services PMI improved to 55.4 in August from 54.1 in July.
US Nonfarm Payrolls rise in August
US Nonfarm Payrolls (NFP) surged by 162K in August, according to the latest data from the Bureau of Labor Statistics (BLS). This robust gain not only marks a significant acceleration from July’s modest 21K increase, but also broadly beats consensus forecasts of 56K, signaling unexpected labor market resilience.
Additional report metrics reveal the Unemployment Rate held steady at 4.1%, in line with expectations, while Labor Force Participation edged higher to 61.6%. Meanwhile, annual wage inflation, tracked by Average Hourly Earnings, eased to 3.1%, down slightly from 3.2%, reflecting a modest cooling in wage growth.
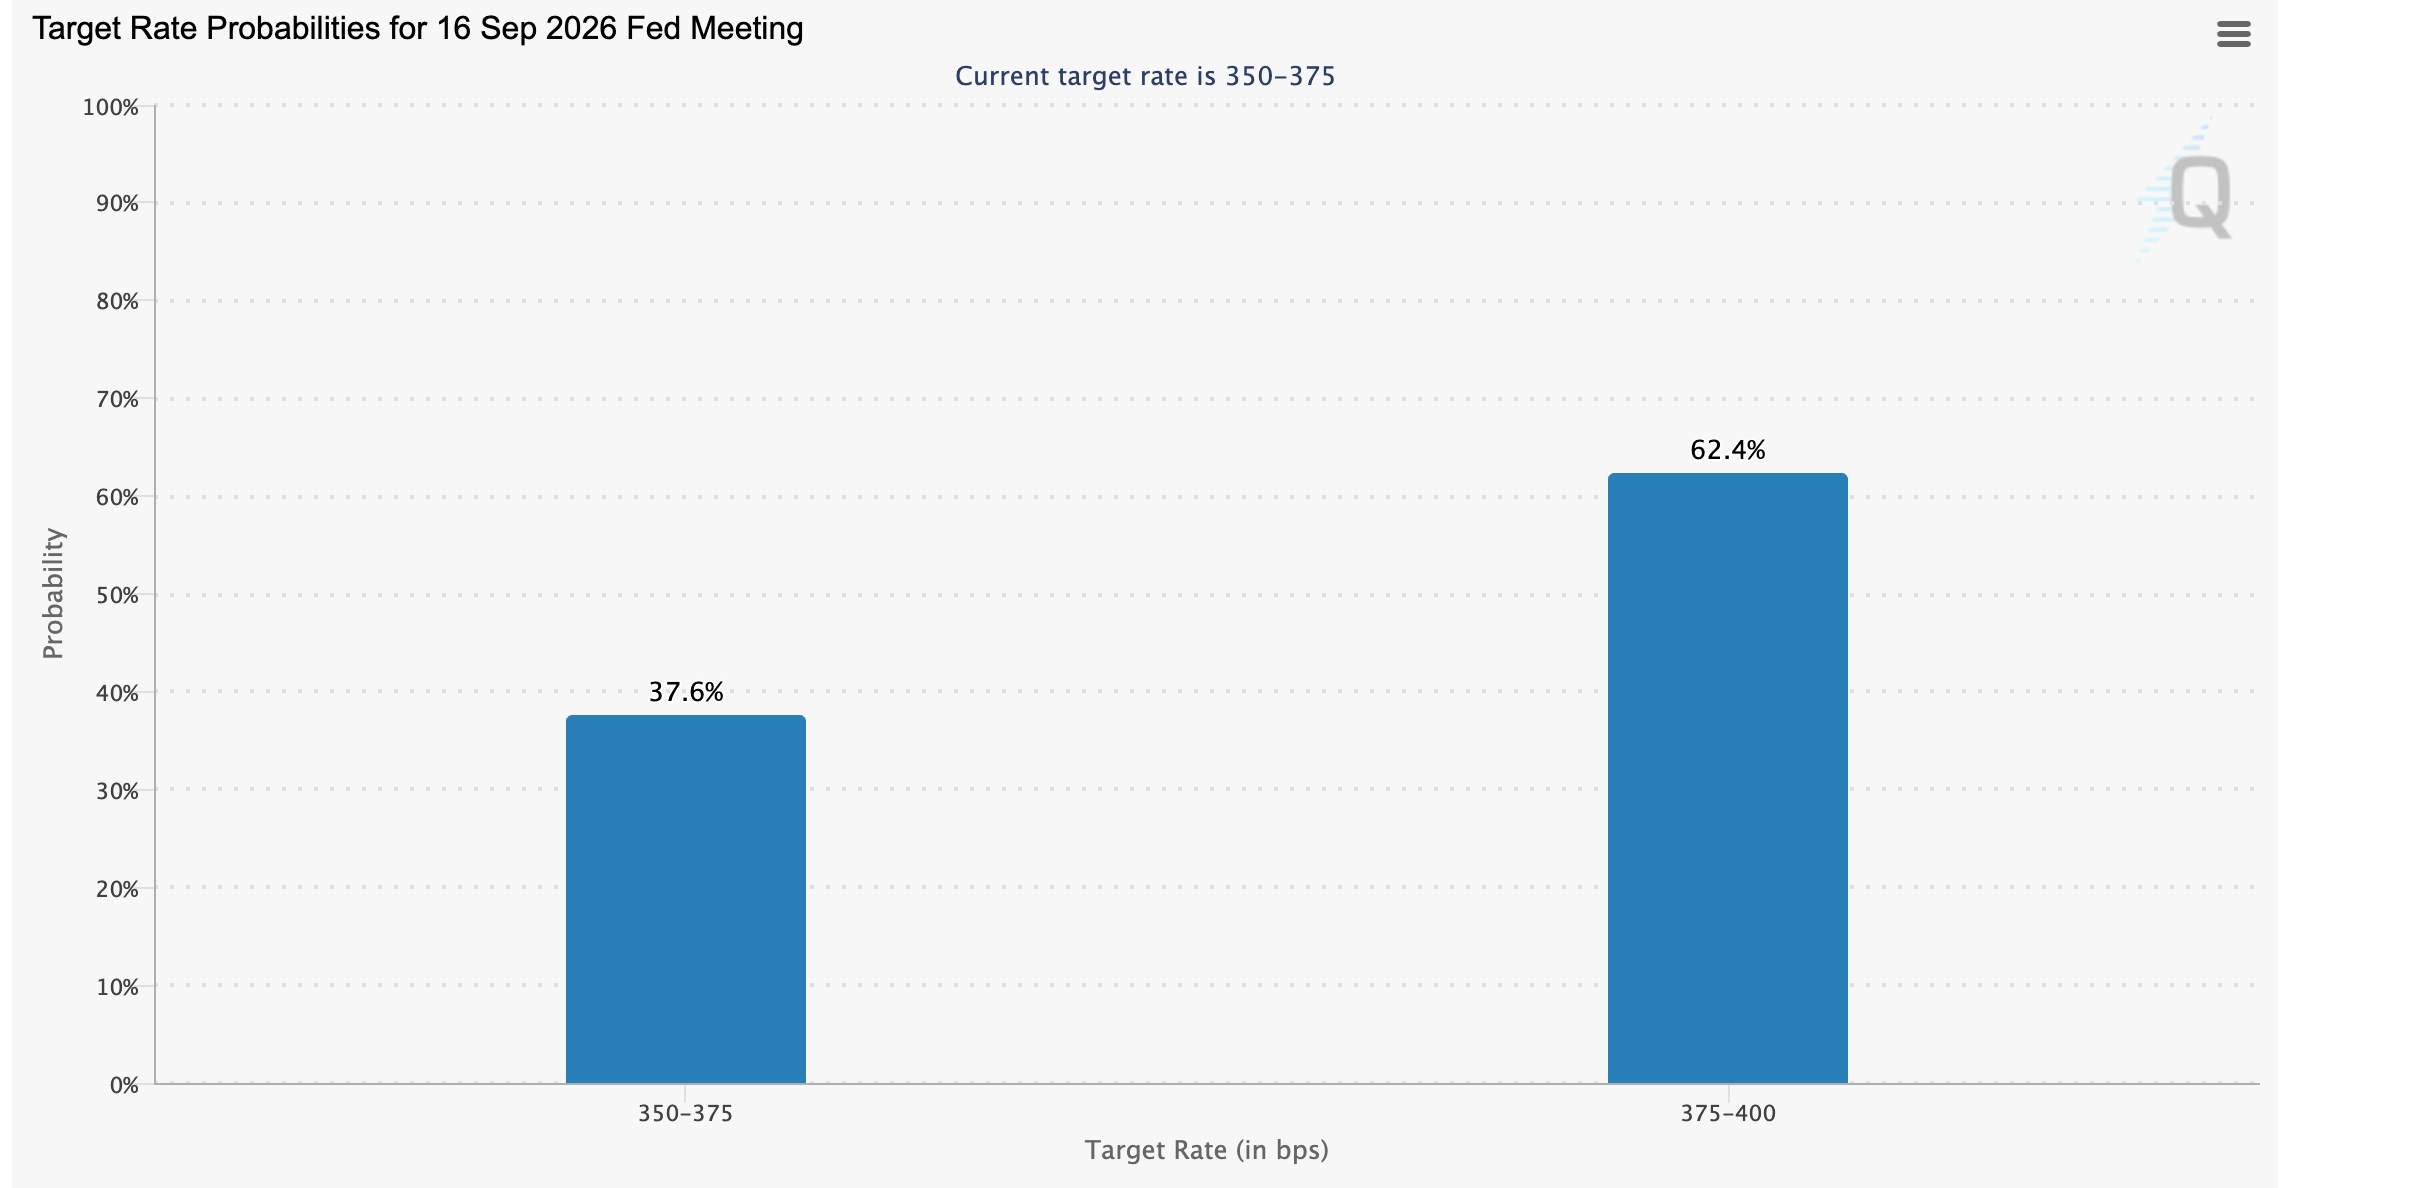
Bitcoin and Gold shed gains after the NFP report, as investors price in a 60% probability that the Federal Reserve (Fed) will raise interest rates to the 3.75%-4.00% range from 49% a day earlier, according to the FedWatch tool
Technical analysis: Bitcoin slides amid broader bullish bias
Bitcoin trades at $79,450 with a constructive bullish bias as price holds well above key Exponential Moving Averages (EMAs), providing a rising trend backdrop. The Relative Strength Index (RSI) hovers near 66 on the daily chart, suggesting firm but not extreme buying pressure, while the latest downtick in the Moving Average Convergence Divergence (MACD) histogram hints at some loss of upside momentum rather than a confirmed reversal.
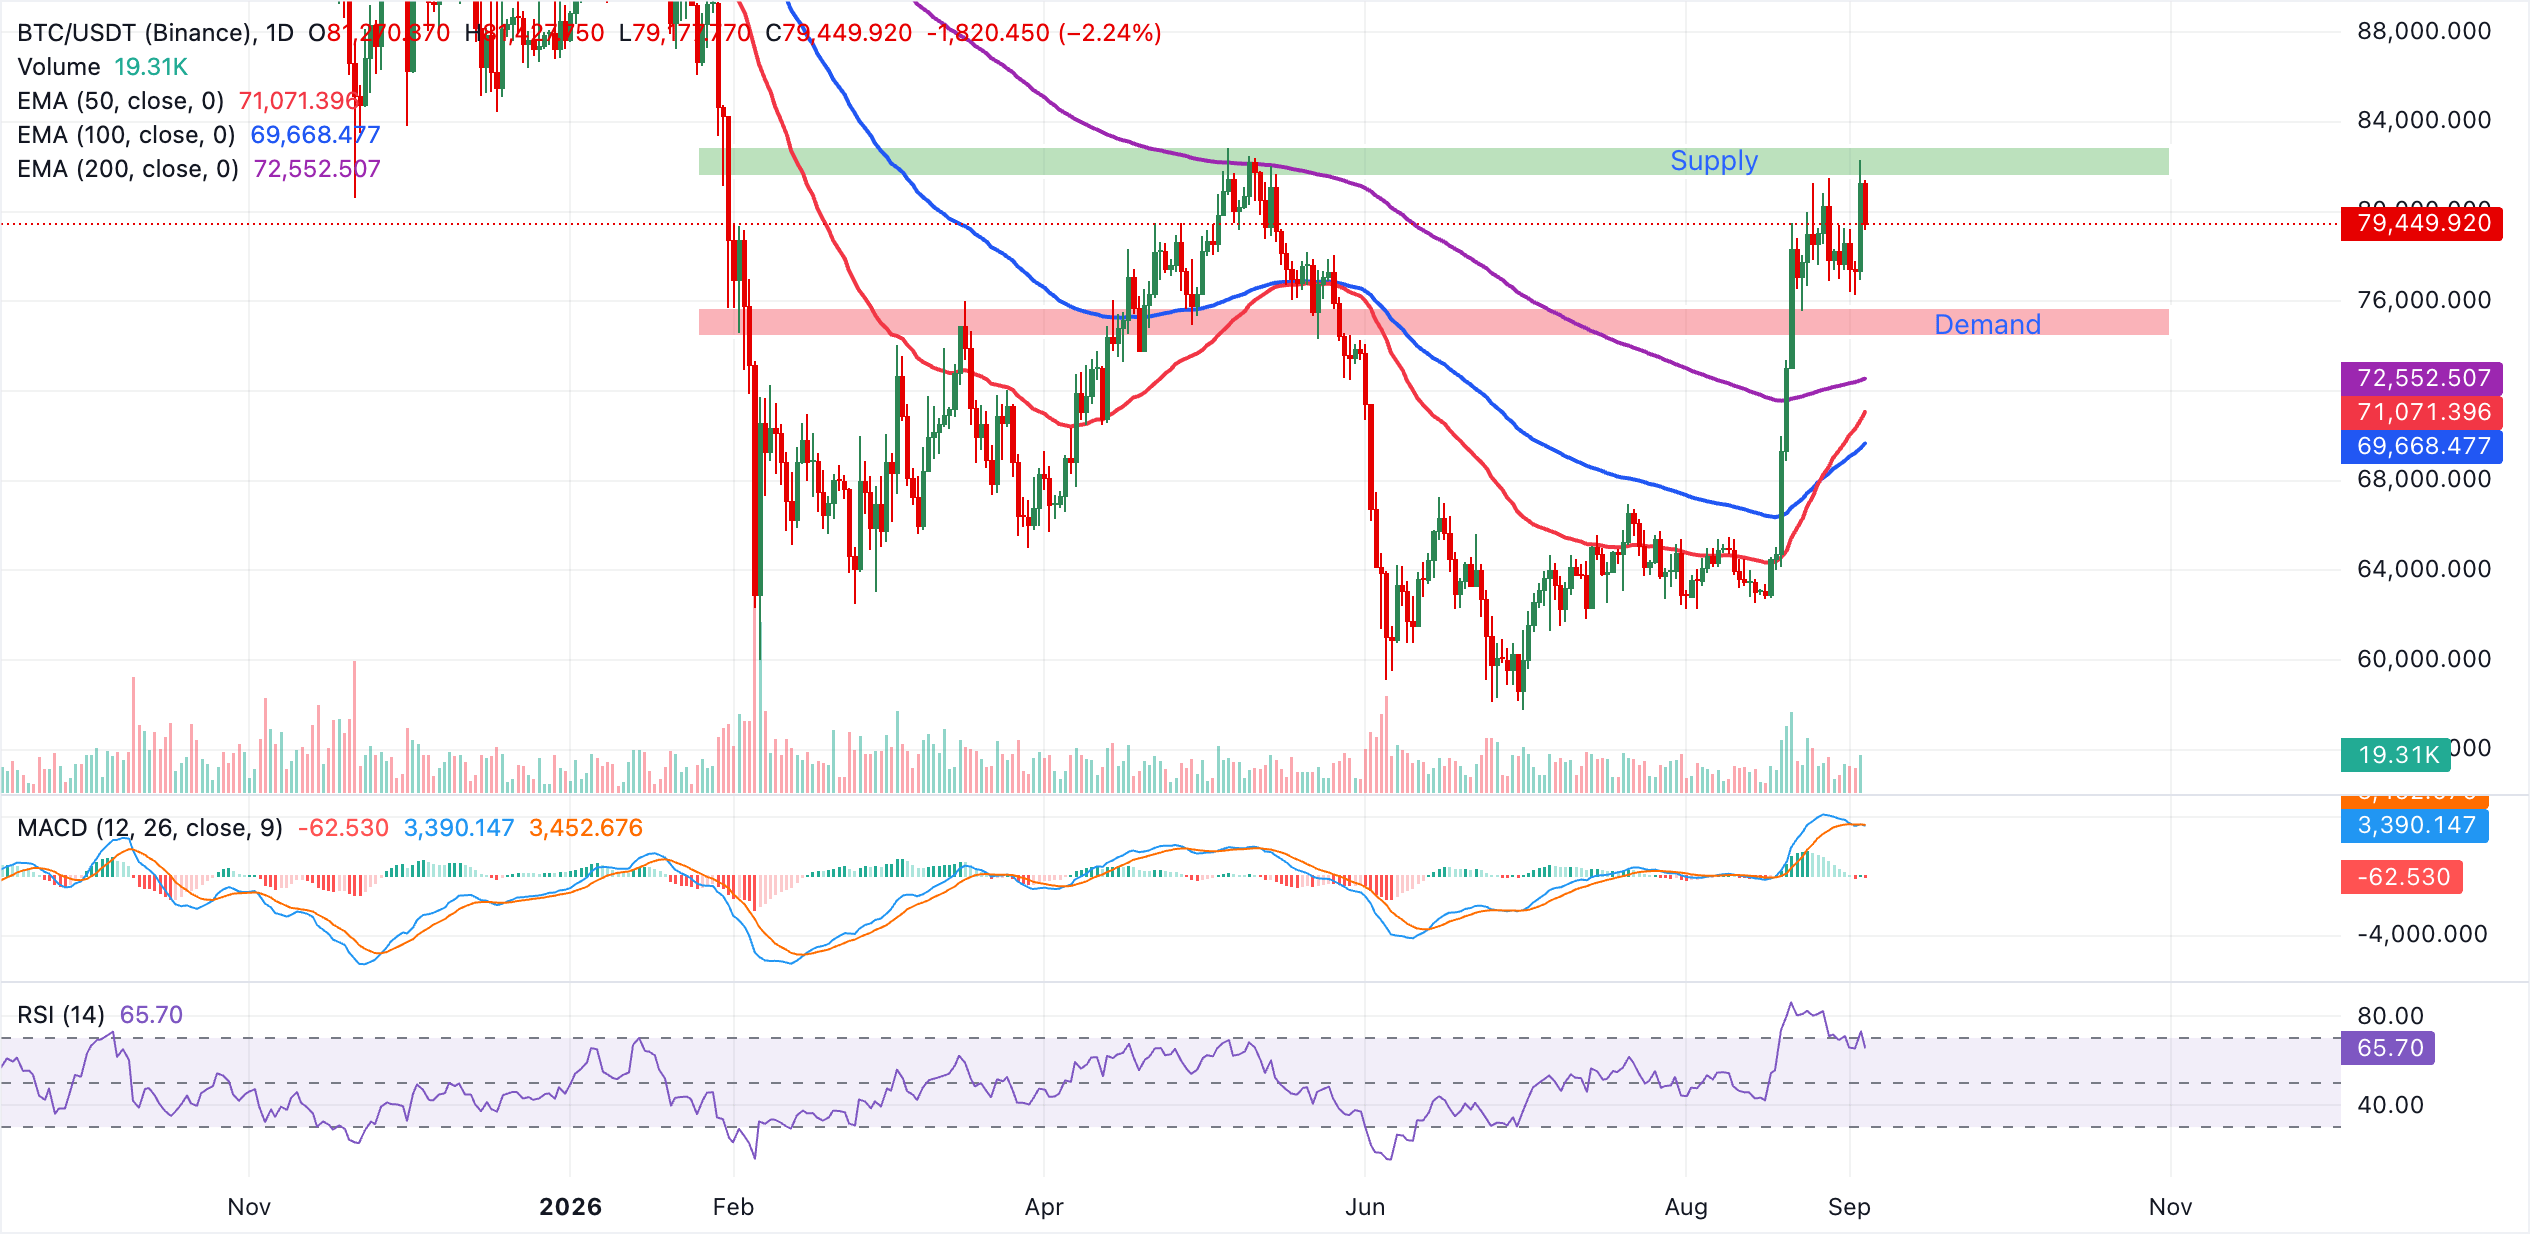
Initial support is seen at the 200-day EMA around $72,553, with the shorter-term 50-day EMA at $71,071 acting as secondary dynamic support. A deeper pullback would expose the 100-day EMA near $69,668 as the next key demand area that would need to hold to preserve the broader uptrend. With no nearby measured resistance on the daily chart, price action will likely remain driven by how well these EMA supports absorb corrective dips.
Gold technical analysis: XAU trims gains testing $4,400 support
Gold trades above $4,400 after correcting from the daily high of $4,491. The metal holds above the 50-day, 100-day and 200-day Exponential Moving Averages (EMAs), keeping the broader backdrop mildly constructive despite the recent pullback from this week’s highs.
Momentum, however, has cooled, with the RSI hovering near 52 and the MACD deep in negative territory, suggesting upside attempts could be labored rather than impulsive as the market digests prior gains.
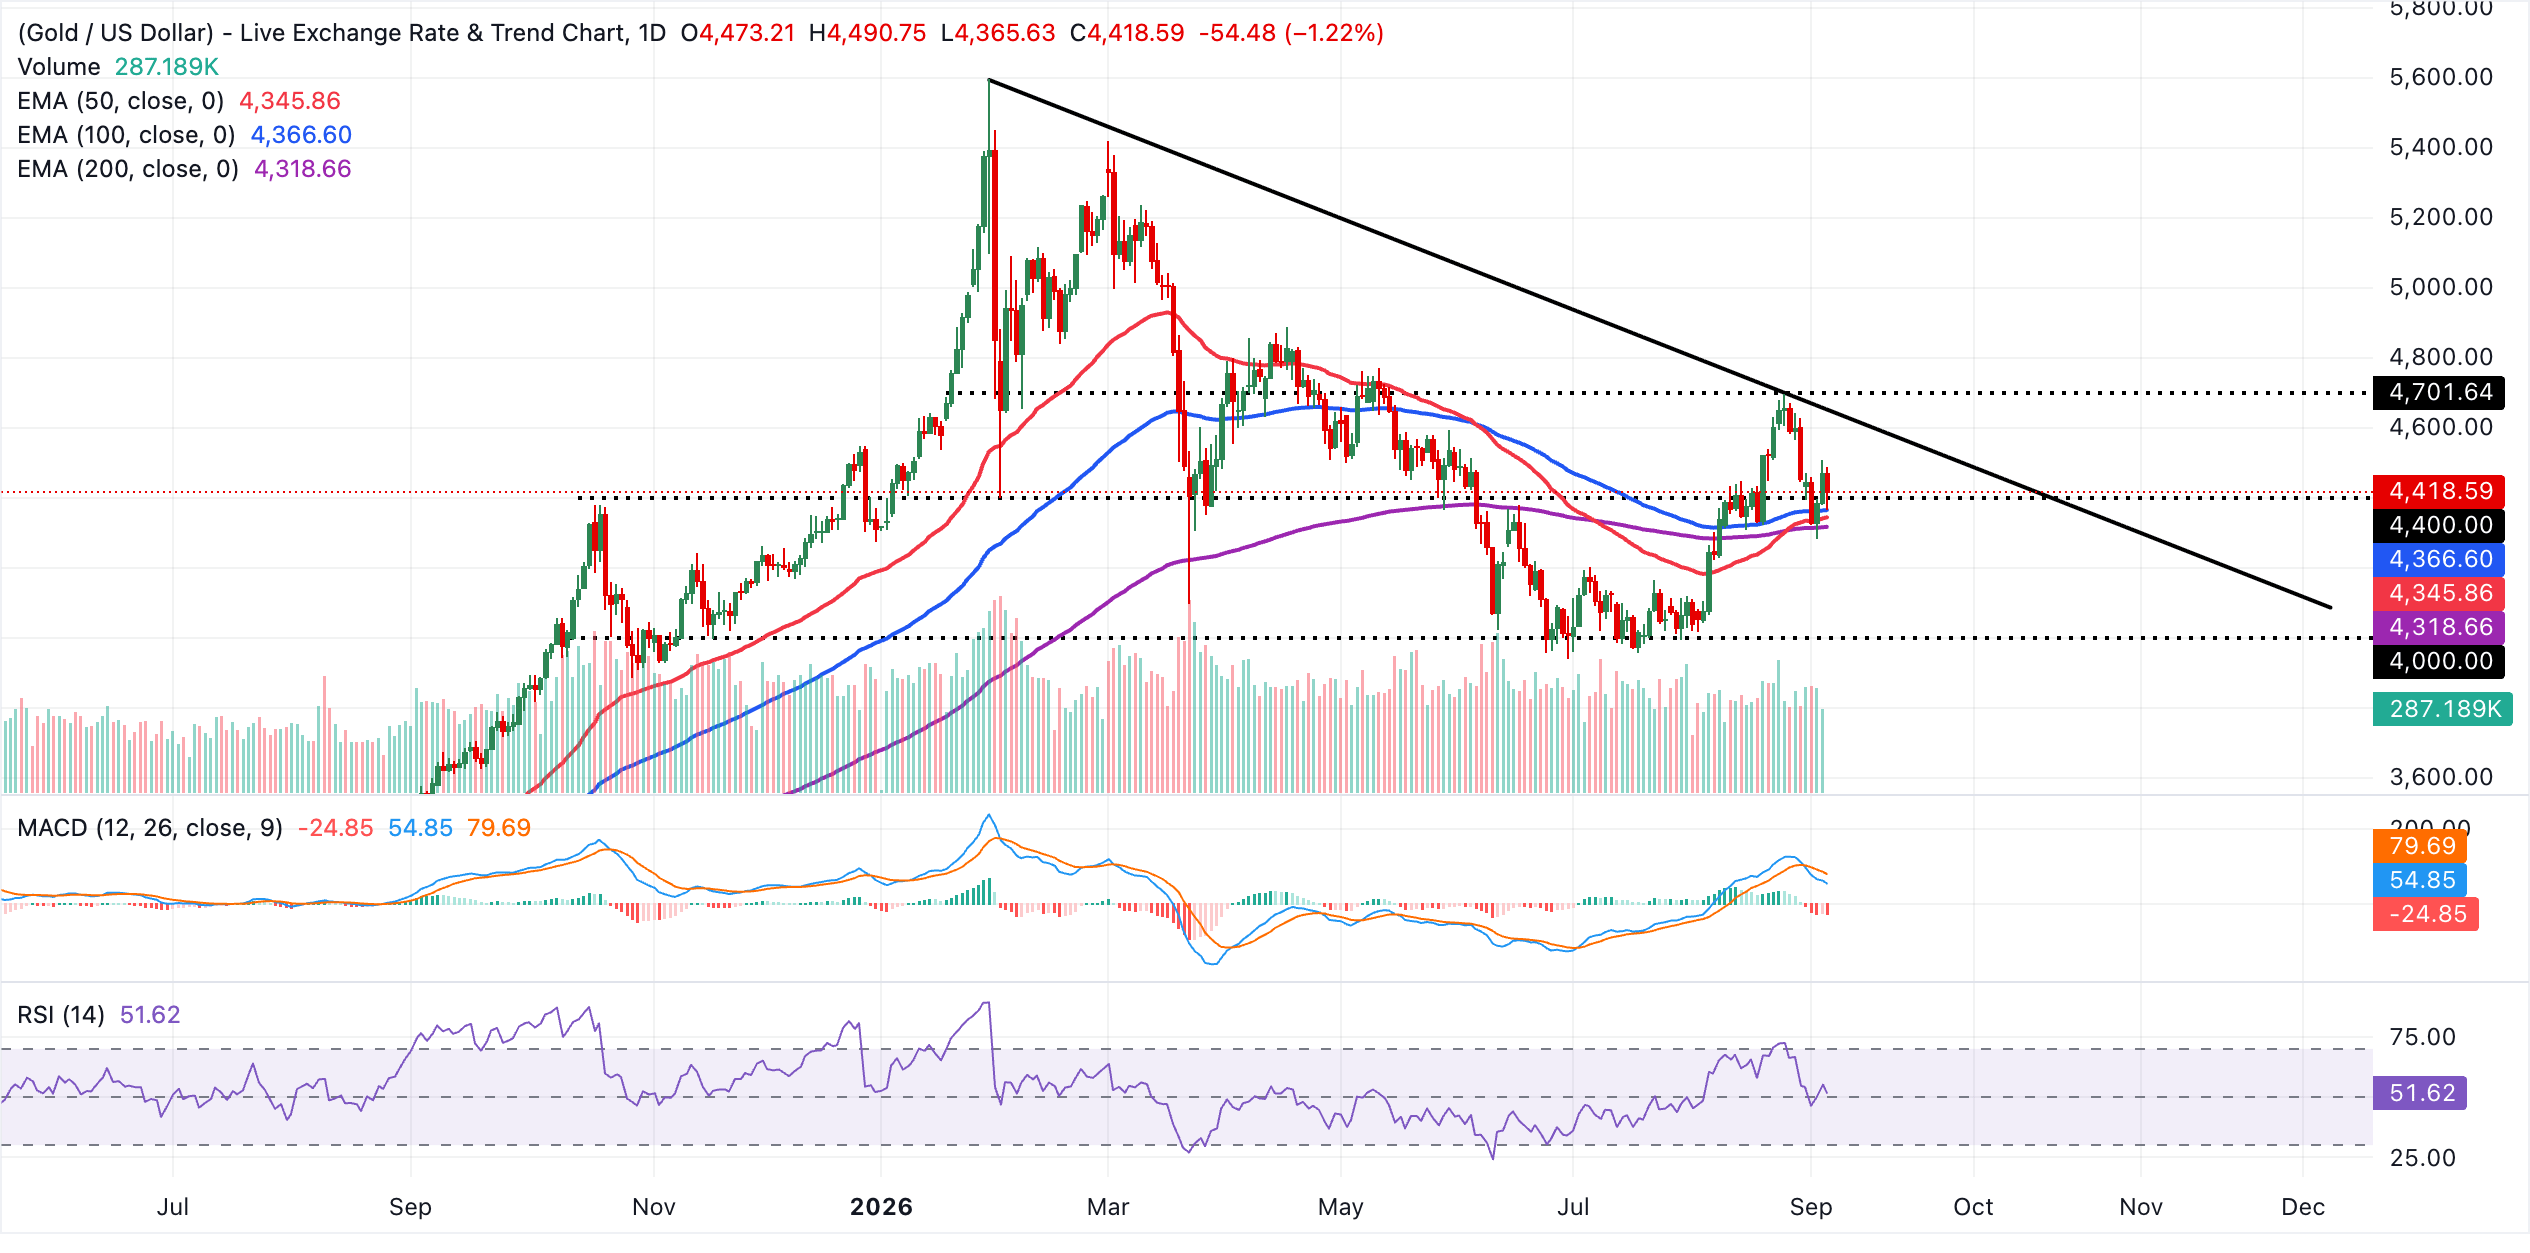
Initial resistance is aligned with the downward resistance trendline around $4,536, and a daily close above this barrier would reopen the path toward the next psychological level at $4,600. On the downside, immediate support lies at the 100-day EMA near $4,367, followed by the 50-day EMA around $4,346 and the 200-day EMA close to $4,319, where buyers would be expected to defend the prevailing uptrend as long as these layers hold.
(The technical analysis of this story was written with the help of an AI tool. Know more.)
Recommended Articles


