

Arbitrum Surges Over 14% in a Single Day, Outperforming Major Coins to Lead Crypto Market

Source Tradingkey

TradingKey - Arbitrum surges over 14% against the trend, strongly leading the Layer 2 sector to become the market rebound leader.

On September 3, amid rising geopolitical tensions and weakness in most mainstream tokens across the broader market, Arbitrum (ARB) surged against the trend, jumping over 14.05% in a single day to become today's best-performing asset in the crypto market. In addition, the price of ARB broke through $0.12, reaching a new high since May 16 of this year.
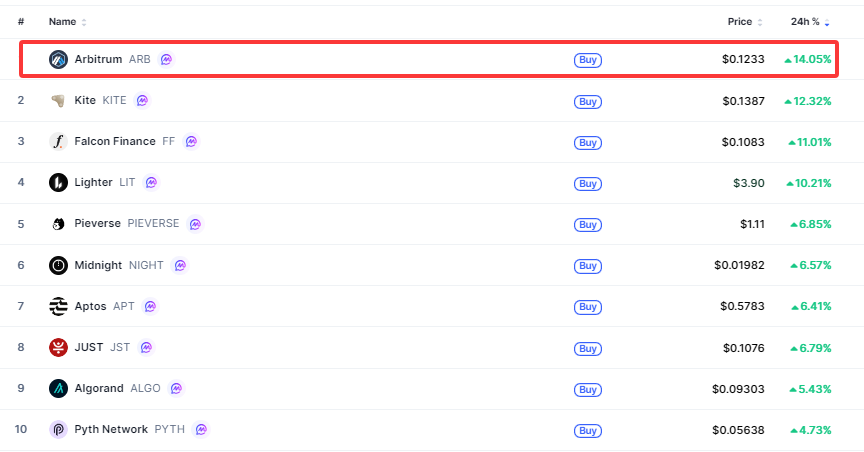
Crypto-marketcap-top10-792b6a9e496e46fa980b47585348d81dTop 10 gaining cryptocurrencies, source: CoinMarketCap

The primary driver behind ARB's counter-trend breakout is the recent sharp rise in its ecosystem's on-chain activity, which drove significant growth in on-chain transaction volume and fee revenue. Among these, the highly watched Robinhood Chain is one of the ecosystem chains built on the Arbitrum Orbit framework. According to the Arbitrum Expansion Program protocol rules, 10% of the fees generated by Orbit chains must flow back to the Arbitrum protocol, with 8% injected into the DAO treasury, providing strong fundamental support for ARB.

From a technical analysis perspective, ARB has over 20% upside potential remaining before reaching its next resistance level at $0.15. However, the likelihood of ARB breaking through this level is relatively low, not only because a large volume of trapped positions is concentrated here, but also because Arbitrum will unlock over 90 million tokens on September 16, creating immense potential selling pressure.
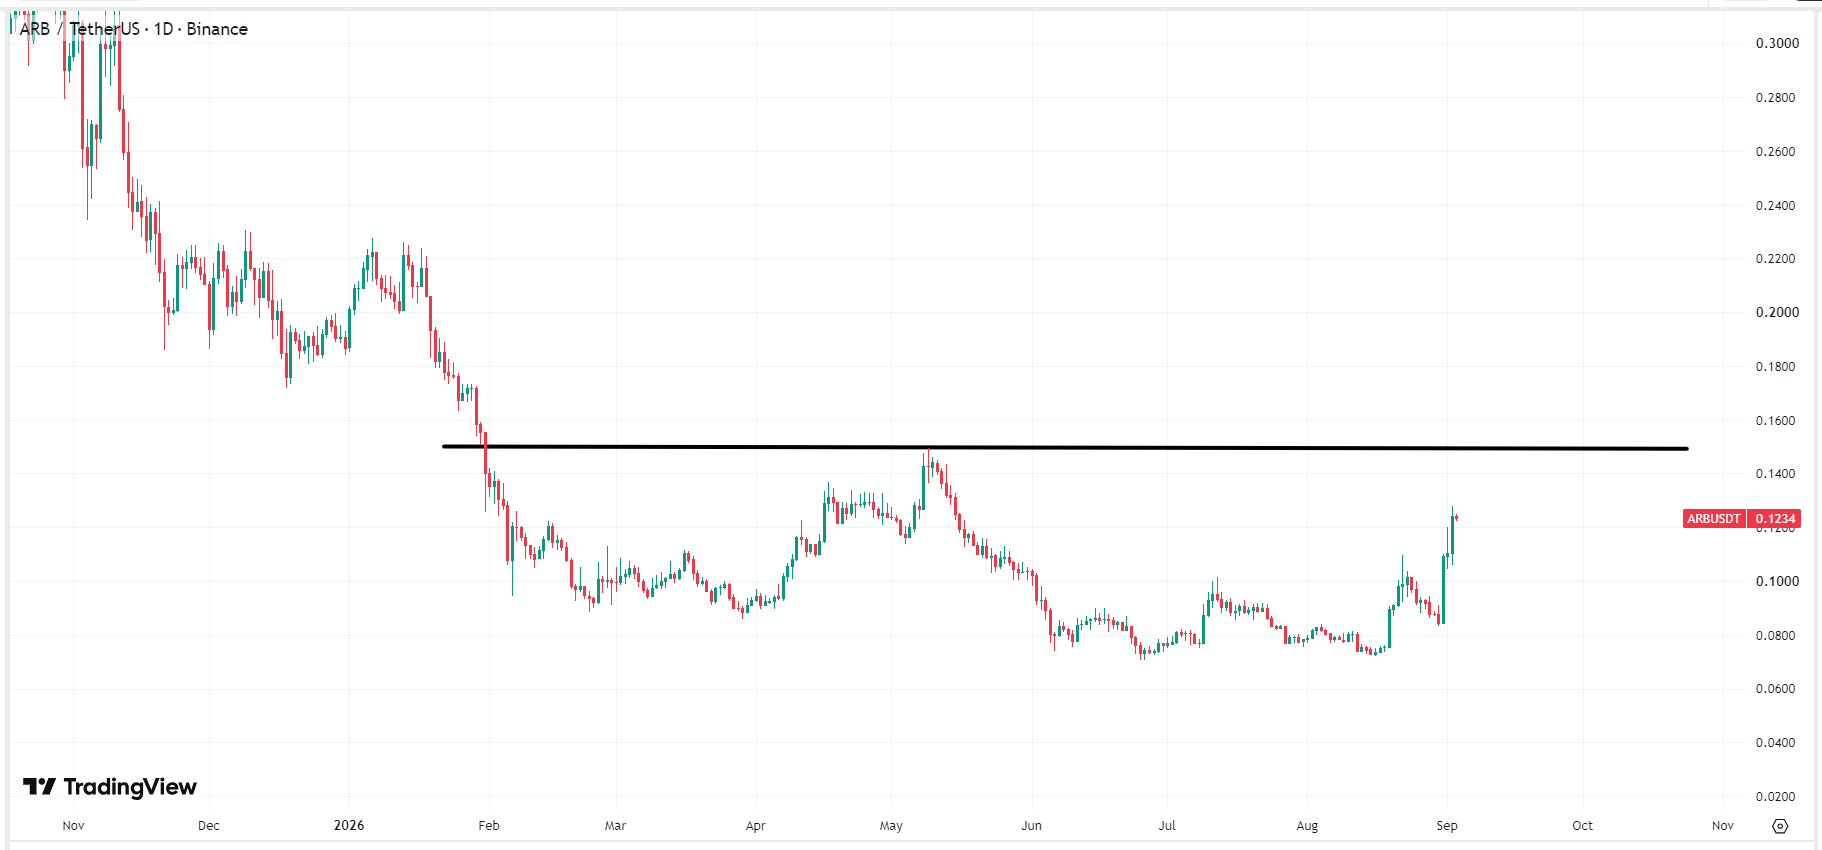
arb-eth-9cff0482d6824870b232198419a55d56ARB price chart, source: TradingView

Disclaimer: For information purposes only. Past performance is not indicative of future results.
placeholder
XRP Price Prediction for July 2026: Can Buyers Finally Break the Downtrend?XRP (XRP) price trades near $1.05, caught between a year-long downtrend and a sudden burst of buying.July has historically rewarded XRP holders. This year the month arrives with on-chain accumulation
Author  Beincrypto
Jun 30, Tue
XRP (XRP) price trades near $1.05, caught between a year-long downtrend and a sudden burst of buying.July has historically rewarded XRP holders. This year the month arrives with on-chain accumulation
placeholder
NVIDIA Price Forecast: Michael Burry Shorts NVDA, but Analysts See $299On July 1, NVIDIA (NASDAQ: NVDA) sits at $198.34, failing to break above the former support level that is now serving as resistance between $198 and $205 on the 2H chart's downward blue c
Author  TradingKey
Jul 02, Thu
On July 1, NVIDIA (NASDAQ: NVDA) sits at $198.34, failing to break above the former support level that is now serving as resistance between $198 and $205 on the 2H chart's downward blue c
placeholder
XAUUSD Gold Analysis: Gold Holds Above $4,350 Ahead of US Inflation Data Is $4,500 Next? Gold holds above $4,350 following weak US jobs data. As inflation reports approach and UBS eyes $5,000, can XAUUSD break resistance at $4,435 to rally toward $4,500?
Author  Naoufal Seddik
Aug 12, Wed
Gold holds above $4,350 following weak US jobs data. As inflation reports approach and UBS eyes $5,000, can XAUUSD break resistance at $4,435 to rally toward $4,500?
placeholder
Gold Price Analysis Today: Gold Drops 1.32% Despite Lower Fed Rate-Hike Bets, Can $4,313 Support Hold? Gold fell 1.32% on August 13 after rising to $4,449.73, then reversing lower and closing near $4,349.918 below the $4,356.46 support. Softer US inflation data reduced Fed rate hike expectations, but selling pressure still dominated the session. Will $4,313 support hold?
Author  Naoufal Seddik
Aug 14, Fri
Gold fell 1.32% on August 13 after rising to $4,449.73, then reversing lower and closing near $4,349.918 below the $4,356.46 support. Softer US inflation data reduced Fed rate hike expectations, but selling pressure still dominated the session. Will $4,313 support hold?
placeholder
Gold Price Analysis Today: Gold Rebounds After 1.91% Drop as Yields Ease. Is $4,449 Next? Gold fell about 1.91% on August 18 before producing a strong bullish reaction from the 1-hour demand zone in early August 19 trading. RSI is recovering from oversold conditions, but Supertrend remains bearish as traders await the Fed minutes.
Author  Naoufal Seddik
Aug 19, Wed
Gold fell about 1.91% on August 18 before producing a strong bullish reaction from the 1-hour demand zone in early August 19 trading. RSI is recovering from oversold conditions, but Supertrend remains bearish as traders await the Fed minutes.
goTop
quote