


Ethereum Price Forecast: ETH gains over 30% in August, fueled by ETF inflows and whale accumulation
- Ethereum gained 32.5% in August, its best-performing month since July 2025.
- The rise was fueled by $1.85 billion in inflows into ETH ETFs, alongside whale accumulation.
- ETH breaks the $2,431 support, with bears targeting the 20-day EMA.
Ethereum (ETH) holds above $2,400 on Tuesday after recording a 32.5% gain in August, its best-performing month since July 2025. This marks two consecutive positive months for the top altcoin as it continues its recovery from a nearly 70% drop spanning October to June.
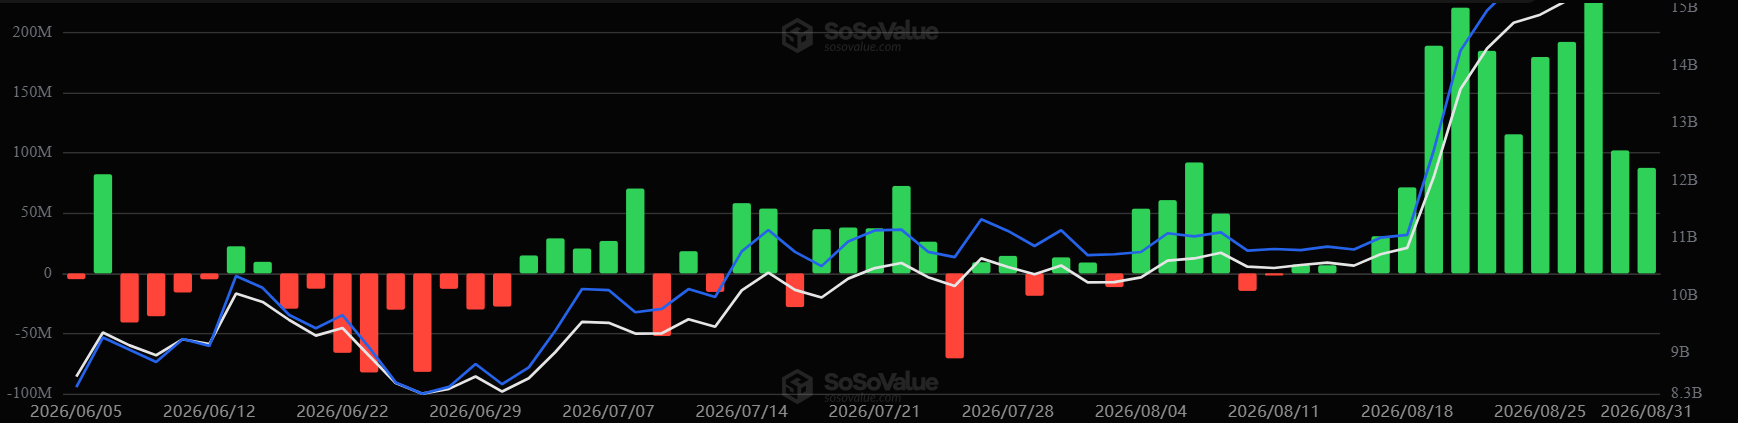
US spot ETH exchange-traded funds (ETFs) played a key role in the recovery, attracting $1.85 billion in net inflows, its best month in over a year, per SoSoValue data. The products ended August on an 11-day inflow streak, with only four negative days throughout the month.
August also saw major rotation across wallet cohorts. Investors with a balance of 10K-100K ETH, which fall within the whale bracket, accumulated 430K ETH during the month, with nearly all of that figure coming in the past two weeks as ETH began to rally.
Meanwhile, retail investors, wallets with a balance of 100-1K and 1K-10K ETH, offloaded 447K and 292K ETH, respectively, with distributions accelerating in the last two weeks.
-1788295344569.png)
With the rotation accelerating during the recent ETH rally, it suggests whales are accumulating supply from retail investors who are potentially booking profits or stepping to the sidelines after breaking even. The Realized Price, or average on-chain cost basis of the 100-1K and 1K-10K ETH cohorts at $2,350 and $2,260, shows these investors have largely been distributing, given the latter.
Meanwhile, inflows into staking contracts also increased, with Ethereum staking contracts adding 1.4M ETH during the month, their largest since February 2024. With more supply locked in staking contracts, available selling pressure reduces, improving the price growth outlook.
Ethereum technical outlook: ETH eyes 20-day EMA after break below $2,431 support
Ethereum saw $71.6 million in liquidations over the past 24 hours, led by $59 million in long liquidations.
On the daily chart, ETH is extending its advance well above all major Exponential Moving Averages (EMAs), reinforcing a bullish near-term bias. Momentum remains constructive with the 14-day Relative Strength Index (RSI) hovering in the mid-60s and the Stochastic Oscillator (Stoch) holding in overbought territory, suggesting strong but increasingly stretched buying pressure as price hovers just over the nearby horizontal level around $2,431.
On the downside, ETH briefly broke the immediate support at the $2,431 horizontal line. The 20-day EMA follows that level at $2,310, which would be the first meaningful dynamic floor on a pullback. Below that, cluster support emerges from the 200-day EMA at $2,220 and the $2,172 horizontal level, ahead of deeper downside levels at the 50 and 100-day EMAs at $2,115 and $2,046, respectively.
On the topside, initial resistance emerges at $2,656, ahead of a higher barrier at $2,787, where a decisive break would open the door for a continuation of the prevailing uptrend.
(The technical analysis of this story was written with the help of an AI tool. Know more.)
Recommended Articles


