

Arbitrum (ARB) Surges 37% in Single Day, Tops $1.1 to Hit Four-Month High

Source Tradingkey

TradingKey - Arbitrum (ARB) broke out of a three-month consolidation period, surging 37% in a single day to stand above the $1.1 level.

On September 1, while cryptocurrencies trended lower amidst volatility, Ethereum (ETH) Layer 2 scaling leader Arbitrum (ARB) staged a strong breakout rally, leading the entire crypto market. Over the past 24 hours, the price of ARB surged 37.75%, decisively breaking above $1.1 to reach a new high since mid-August.
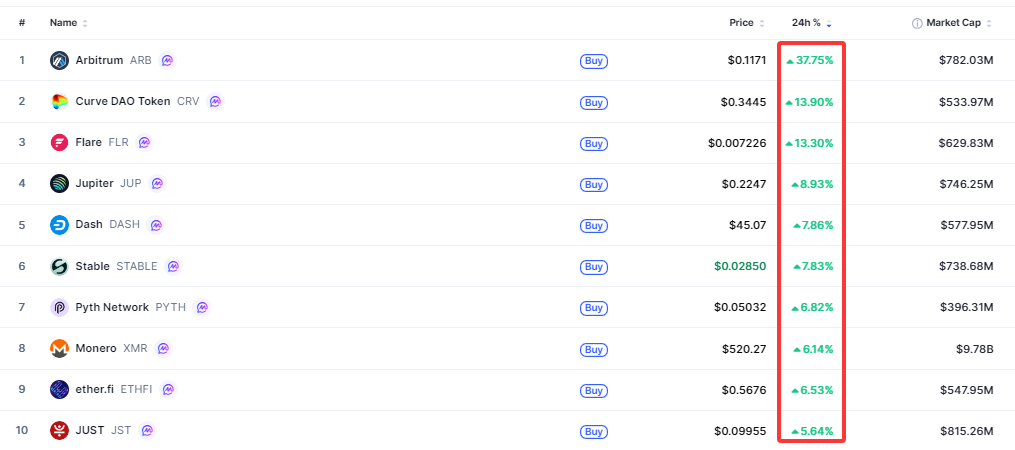
Crypto-marketcap-top10-1fbfb698149c4ecf98b523c45006523bCryptocurrency top gainers ranking, source: CoinMarketCap

Arbitrum (ARB) has recently seen strong short-term buying pressure and a rebound rally, driven primarily by the implementation of technical upgrades and accelerated inflows of real-world asset (RWA) capital into its ecosystem. Arbitrum successfully completed the ArbOS 61 upgrade, which not only expanded Stylus contract capacity fourfold but also further reduced data availability costs. Moreover, the successful integration of Succinct SP1 zkVM gives Arbitrum both the compatibility of OP-Rollup and the security of zero-knowledge proofs, significantly boosting market confidence in its long-term technological moat.

In addition, the trading volume and total value locked (TVL) of tokenized stocks and ETFs on the Arbitrum chain continue to reach new highs. Meanwhile, the Robinhood chain built on Arbitrum Orbit has demonstrated a powerful effect in funneling traditional finance capital. Coupled with the announcement of related ecosystem revenue-sharing programs, this has incentivized institutional capital and whales to position their holdings toward the end of the month.

After breaking above $1.1, Arbitrum's price will directly challenge the major previous overhead resistance area around $1.5. Without continuous volume expansion to drive the rally, a short-term pullback with an upper shadow is likely. On the downside, the primary focus is whether it can retest and hold above the previous breakout level of $1.00, which has transformed from a three-month resistance level into support.
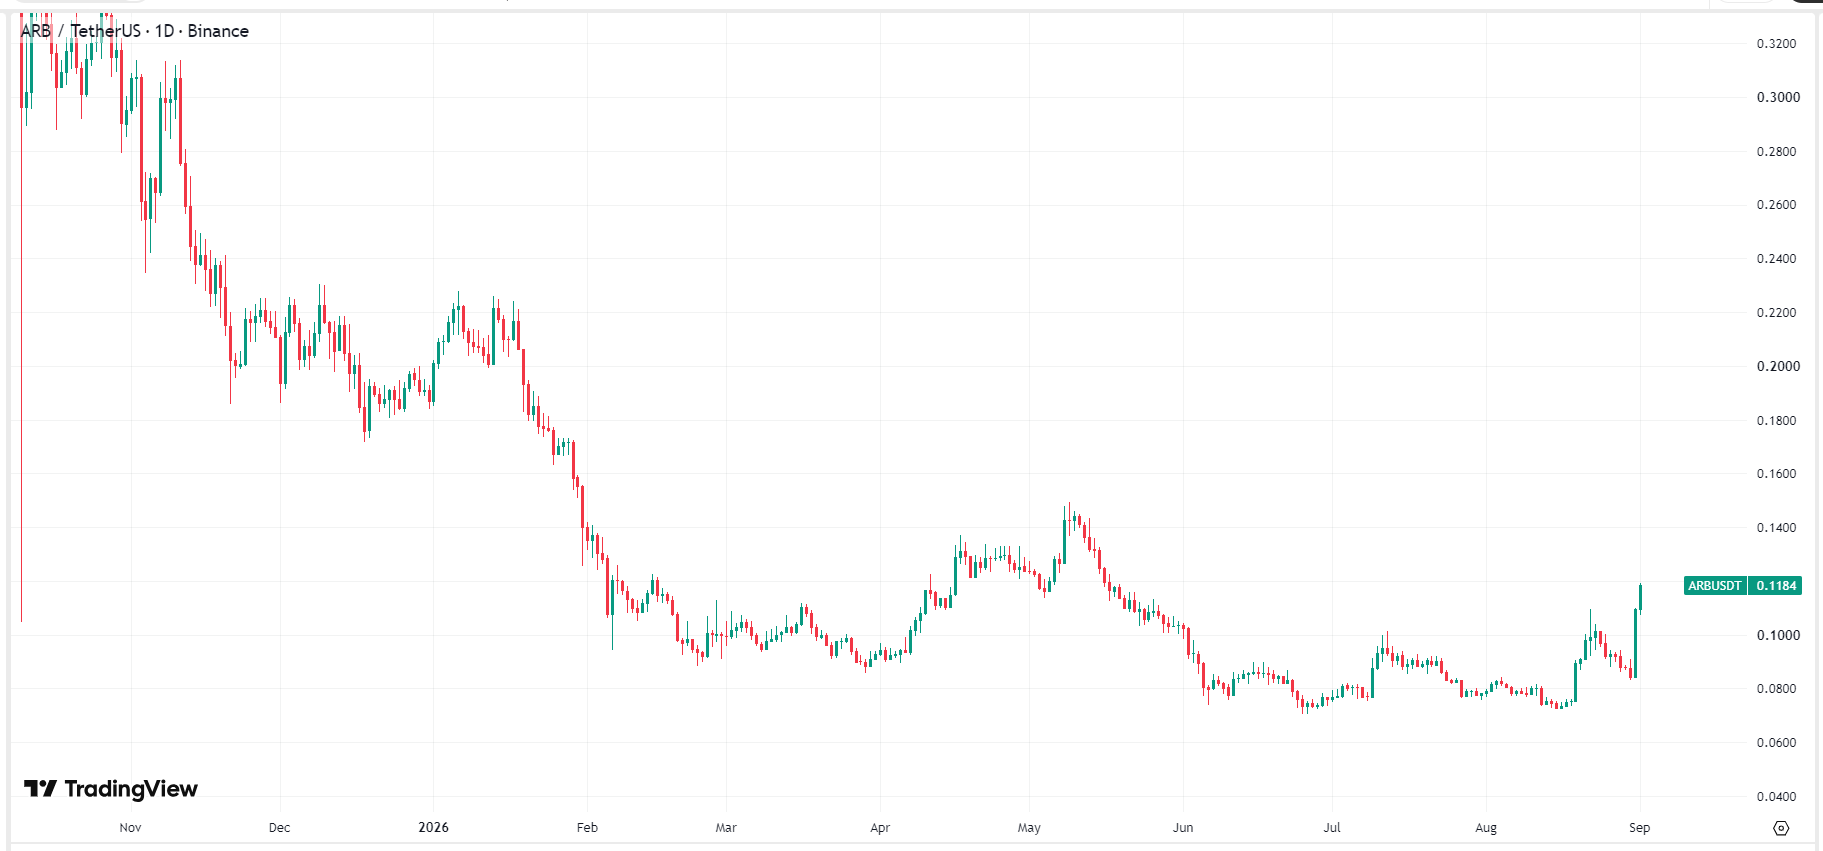
atb-eth-8c023af4f7164692b5a7b1d06b314184ARB price chart, source: TradingView

Disclaimer: For information purposes only. Past performance is not indicative of future results.
placeholder
XRP Price Prediction for July 2026: Can Buyers Finally Break the Downtrend?XRP (XRP) price trades near $1.05, caught between a year-long downtrend and a sudden burst of buying.July has historically rewarded XRP holders. This year the month arrives with on-chain accumulation
Author  Beincrypto
Jun 30, Tue
XRP (XRP) price trades near $1.05, caught between a year-long downtrend and a sudden burst of buying.July has historically rewarded XRP holders. This year the month arrives with on-chain accumulation
placeholder
What to Expect From Ethereum (ETH) in July 2026Ethereum (ETH) enters July 2026 trading near $1,570, close to multi-month lows, after recording its first run of three consecutive red quarterly candles in its history.On-chain data and price charts n
Author  Beincrypto
Jul 01, Wed
Ethereum (ETH) enters July 2026 trading near $1,570, close to multi-month lows, after recording its first run of three consecutive red quarterly candles in its history.On-chain data and price charts n
placeholder
XAUUSD Gold Analysis: Gold Holds Above $4,350 Ahead of US Inflation Data Is $4,500 Next? Gold holds above $4,350 following weak US jobs data. As inflation reports approach and UBS eyes $5,000, can XAUUSD break resistance at $4,435 to rally toward $4,500?
Author  Naoufal Seddik
Aug 12, Wed
Gold holds above $4,350 following weak US jobs data. As inflation reports approach and UBS eyes $5,000, can XAUUSD break resistance at $4,435 to rally toward $4,500?
placeholder
Gold Price Analysis Today: Gold Gains 0.94% as Markets Expect Fed to Hold Rates, Can $4,449 Resistance Break? Gold gained 0.94% on August 17, closing near $4,417.30 as softer US data strengthened expectations for unchanged Fed rates in September. Gold remains bullish, with $4,449.730 resistance and $4,310.650 support in focus.
Author  Naoufal Seddik
Aug 18, Tue
Gold gained 0.94% on August 17, closing near $4,417.30 as softer US data strengthened expectations for unchanged Fed rates in September. Gold remains bullish, with $4,449.730 resistance and $4,310.650 support in focus.
placeholder
Gold Price Analysis Today: Gold Rebounds After 1.91% Drop as Yields Ease. Is $4,449 Next? Gold fell about 1.91% on August 18 before producing a strong bullish reaction from the 1-hour demand zone in early August 19 trading. RSI is recovering from oversold conditions, but Supertrend remains bearish as traders await the Fed minutes.
Author  Naoufal Seddik
Aug 19, Wed
Gold fell about 1.91% on August 18 before producing a strong bullish reaction from the 1-hour demand zone in early August 19 trading. RSI is recovering from oversold conditions, but Supertrend remains bearish as traders await the Fed minutes.
goTop
quote