

Pi Network Price Forecast: PI holds steady as Core Team focuses on distributed AI infrastructure

Source Fxstreet
  • Pi Network trades above $0.0900 on Friday after two consecutive days of recovery.
  • Pi Core Team announced the launch of new SoloHost apps, OpenClaw and Atlassian MCP Server, focusing on distributed AI infrastructure.
  • The technical outlook for PI remains mixed, with momentum indicators at neutral levels.

Pi Network (PI) price hovers above $0.0900 on Friday, sustaining the mild 3% gains recorded over the last two days. Pi Core Team announced the launch of new SoloHost apps, OpenClaw and Atlassian MCP Server, on Thursday, in hopes of expanding the Pi ecosystem. PI token must reclaim the $0.1000 psychological threshold for a sustained recovery.

Pi Core Team launches new SoloHost apps

Pi Network announced the launch of new SoloHost apps, OpenClaw and Atlassian MCP Server, on Thursday. The Pi Core Team aims to expand the utility of its more than 420,000 active nodes from basic blockchain validation to distributed AI infrastructure. 

OpenClaw is a local, personalized, on-device AI assistant, and Atlassian MCP Server is a local Jira workflow engine, allowing users to run AI-driven tasks on their own hardware. This suggests Pi Network is shifting from a token mining project toward handling privacy-first, on-device AI workloads. 

Technical outlook: Pi Network’s recovery lacks firm momentum

Pi Network trades around $0.0917 on Friday, following two consecutive bullish daily closes. Still, PI holds a capped near-term bias as price remains below the $0.1000 psychological threshold.

PI token shows a mild recovery from the 23.6% Fibonacci retracement at $0.0853, measured over the downswing from $0.1341 to $0.0703. For a sustained upward trend, PI must reclaim the $0.1000 threshold, reinforced by the 50% retracement level at $0.1022, which capped gains last week and in mid-July. This configuration suggests that despite a mild recovery from recent lows, the broader trend stays under pressure.

The Relative Strength Index (RSI) at 53 on the daily chart shows a mild upward slope above the neutral 50 line, indicating firm buying pressure. The Moving Average Convergence Divergence (MACD) and signal line rise marginally in the modest positive territory, hinting at only tentative upside momentum.
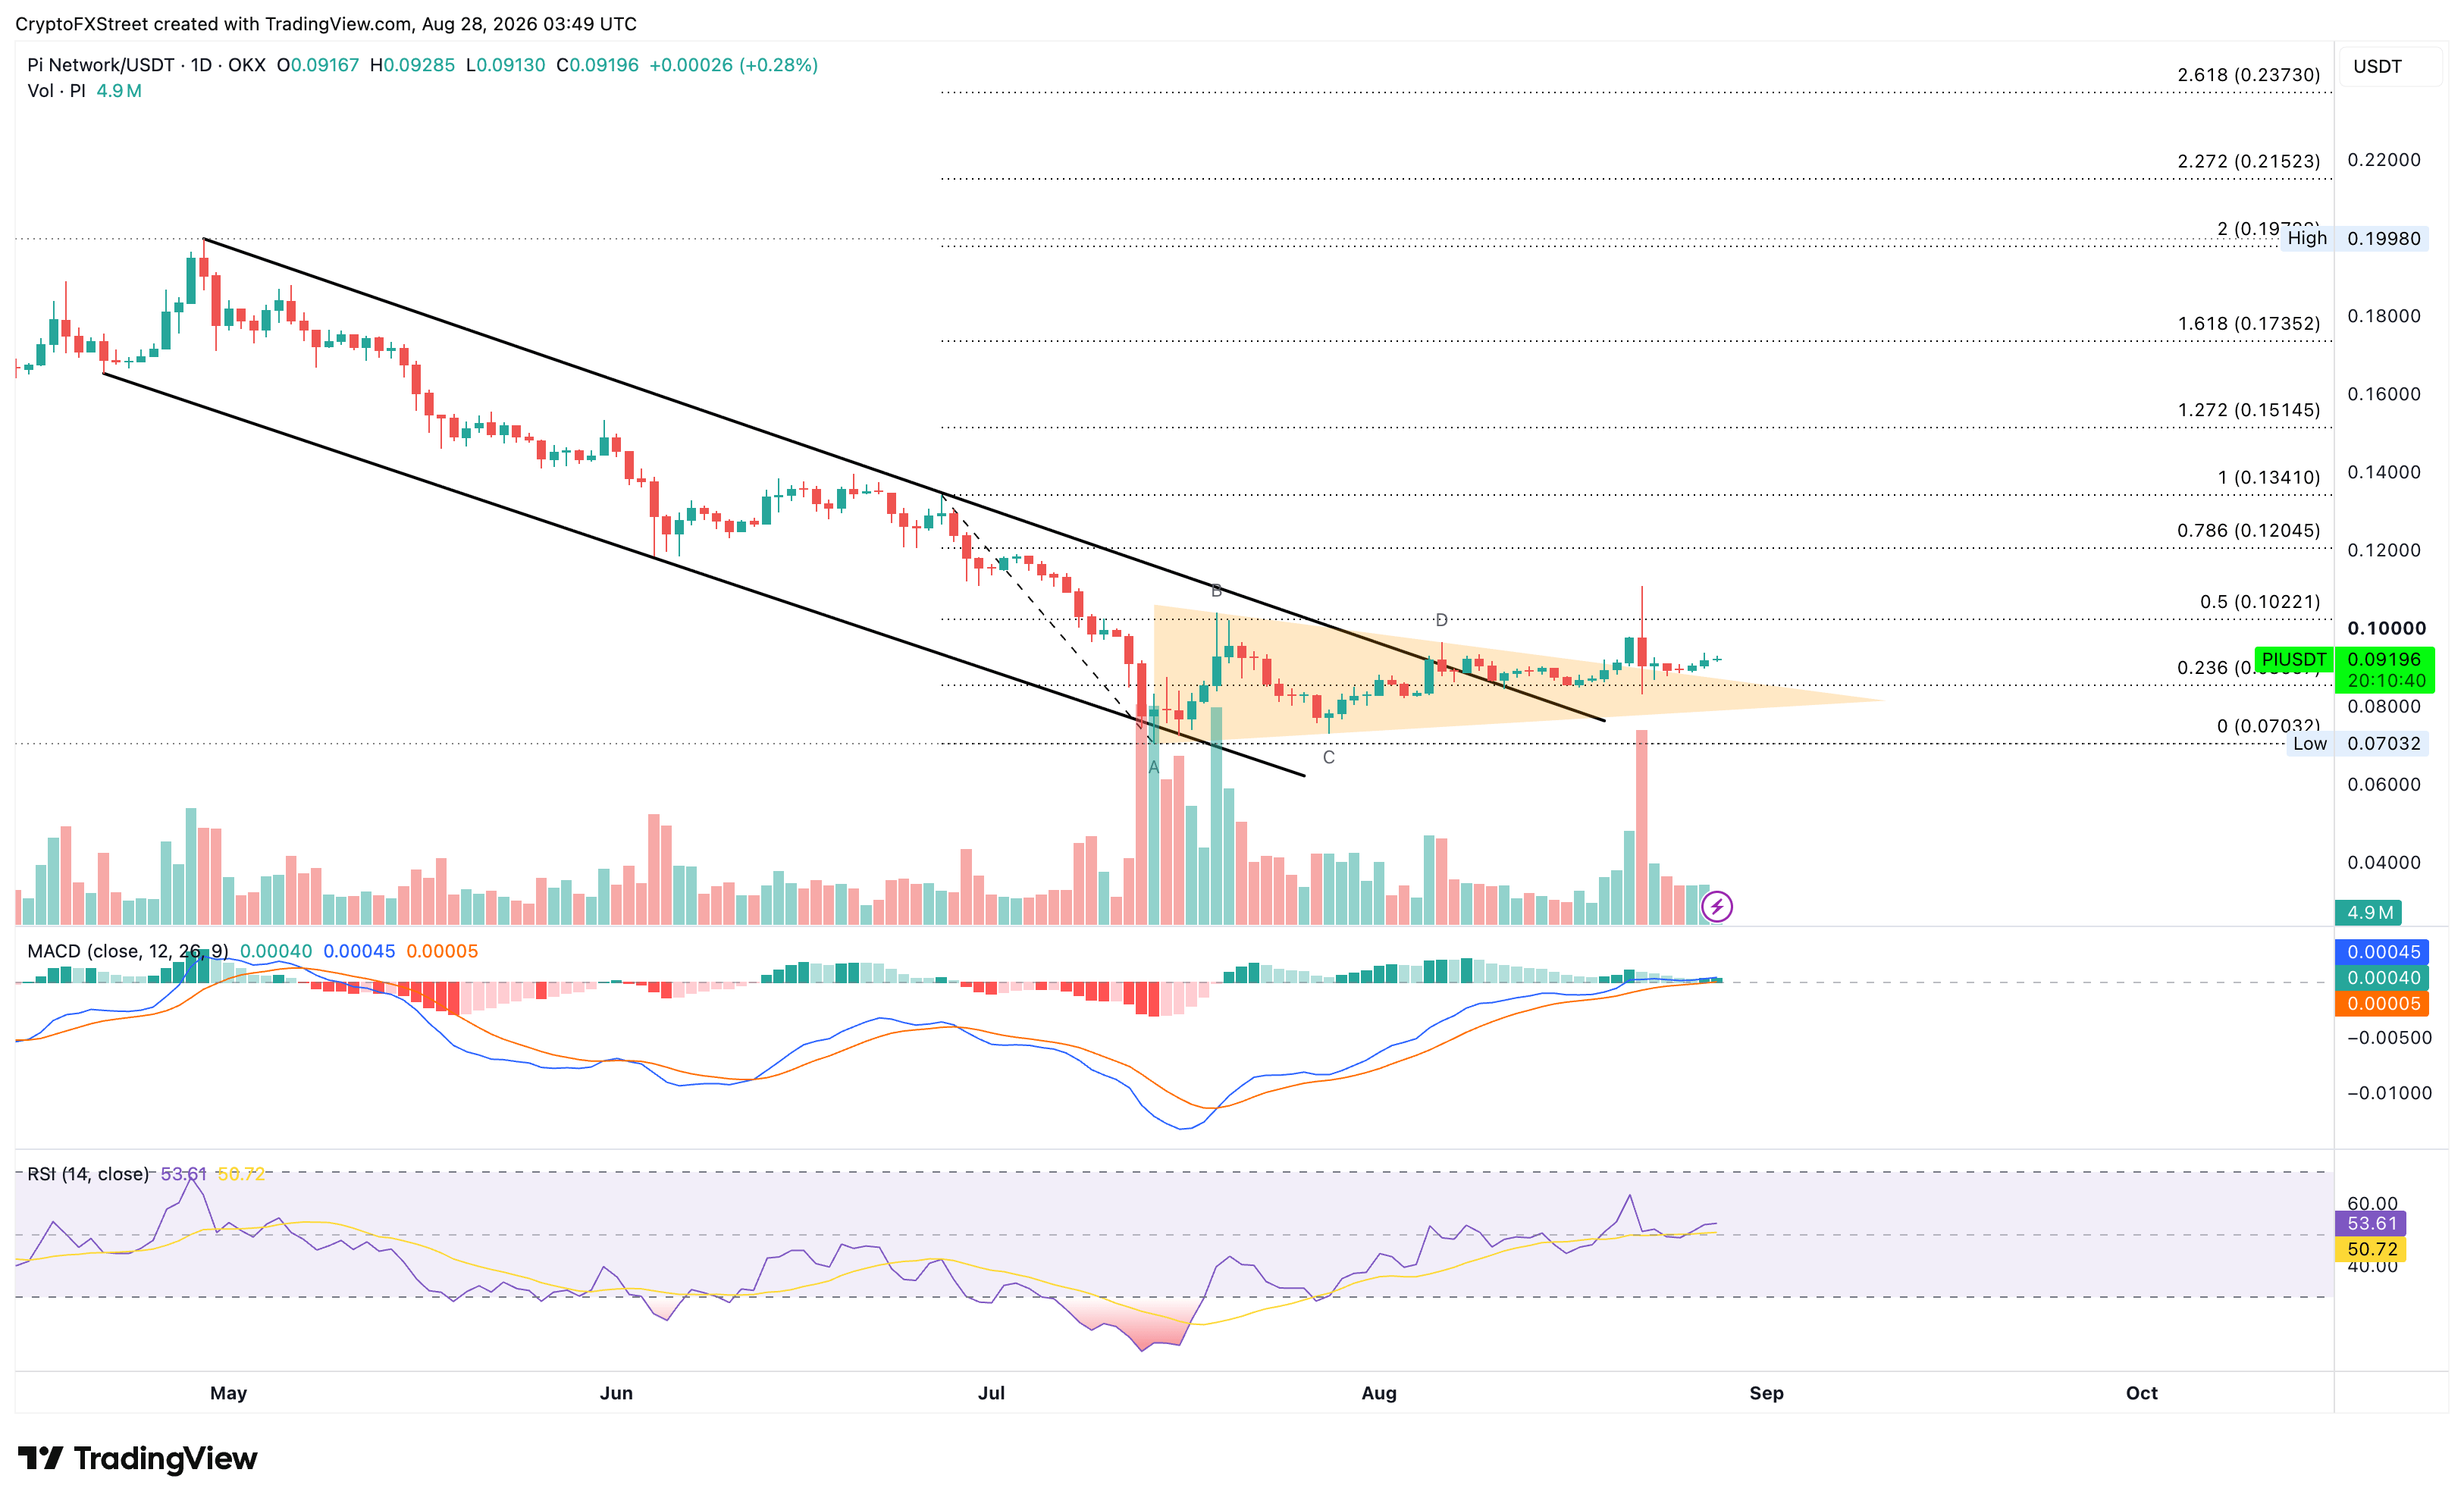
PI/USD daily price chart.

On the downside, the $0.0853 support level remains a key bullish floor. A confirmed breakout below this level could nullify PI rebound odds, risking a decline toward the $0.0703 swing low.

(The technical analysis of this story was written with the help of an AI tool. Know more.)

Disclaimer: For information purposes only. Past performance is not indicative of future results.
placeholder
XRP Price Prediction for July 2026: Can Buyers Finally Break the Downtrend?XRP (XRP) price trades near $1.05, caught between a year-long downtrend and a sudden burst of buying.July has historically rewarded XRP holders. This year the month arrives with on-chain accumulation
Author  Beincrypto
Jun 30, Tue
XRP (XRP) price trades near $1.05, caught between a year-long downtrend and a sudden burst of buying.July has historically rewarded XRP holders. This year the month arrives with on-chain accumulation
placeholder
What to Expect From Ethereum (ETH) in July 2026Ethereum (ETH) enters July 2026 trading near $1,570, close to multi-month lows, after recording its first run of three consecutive red quarterly candles in its history.On-chain data and price charts n
Author  Beincrypto
Jul 01, Wed
Ethereum (ETH) enters July 2026 trading near $1,570, close to multi-month lows, after recording its first run of three consecutive red quarterly candles in its history.On-chain data and price charts n
placeholder
Gold Price Analysis Today: Gold Drops 1.32% Despite Lower Fed Rate-Hike Bets, Can $4,313 Support Hold? Gold fell 1.32% on August 13 after rising to $4,449.73, then reversing lower and closing near $4,349.918 below the $4,356.46 support. Softer US inflation data reduced Fed rate hike expectations, but selling pressure still dominated the session. Will $4,313 support hold?
Author  Naoufal Seddik
Aug 14, Fri
Gold fell 1.32% on August 13 after rising to $4,449.73, then reversing lower and closing near $4,349.918 below the $4,356.46 support. Softer US inflation data reduced Fed rate hike expectations, but selling pressure still dominated the session. Will $4,313 support hold?
placeholder
Gold Price Analysis Today: Gold Gains 0.94% as Markets Expect Fed to Hold Rates, Can $4,449 Resistance Break? Gold gained 0.94% on August 17, closing near $4,417.30 as softer US data strengthened expectations for unchanged Fed rates in September. Gold remains bullish, with $4,449.730 resistance and $4,310.650 support in focus.
Author  Naoufal Seddik
Aug 18, Tue
Gold gained 0.94% on August 17, closing near $4,417.30 as softer US data strengthened expectations for unchanged Fed rates in September. Gold remains bullish, with $4,449.730 resistance and $4,310.650 support in focus.
placeholder
Gold Price Analysis Today: Gold Rebounds After 1.91% Drop as Yields Ease. Is $4,449 Next? Gold fell about 1.91% on August 18 before producing a strong bullish reaction from the 1-hour demand zone in early August 19 trading. RSI is recovering from oversold conditions, but Supertrend remains bearish as traders await the Fed minutes.
Author  Naoufal Seddik
Aug 19, Wed
Gold fell about 1.91% on August 18 before producing a strong bullish reaction from the 1-hour demand zone in early August 19 trading. RSI is recovering from oversold conditions, but Supertrend remains bearish as traders await the Fed minutes.
goTop
quote