


Bitcoin Reclaims Short-Term Holder Cost Basis as the Weekly Moving Average Holds at $81K
Bitcoin is on track for its best August return since 2017, having rallied over 25% so far, according to CoinGlass. That entire move has taken place over the past 10 days with BTC running from $62K on August 17 to a high of $81K on August 25 and now trading at the $78.5K zone. During this move, on August 19, the price crossed above the Short-Term Holder Realized Price at $67,125 and has stayed above it since. Data from Look Into Bitcoin highlights that this is the first convincing reclaim of that level since April last year.
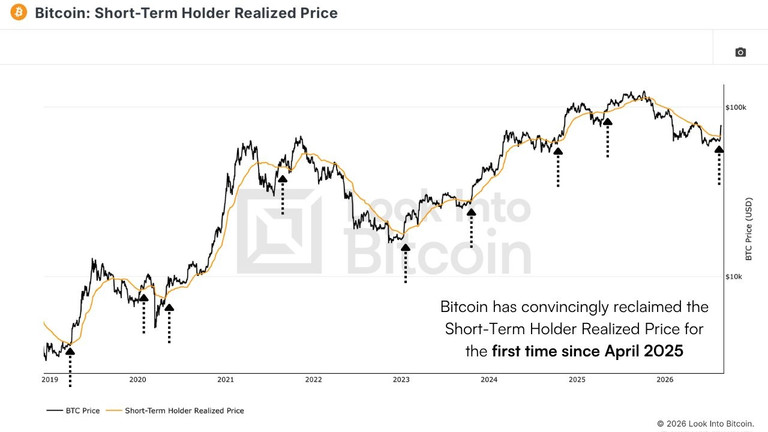
This is an onchain metric that basically tracks the average cost basis of every coin that last moved within 155 days. Think of it as what recent buyers paid on average. When Bitcoin trades below this line, those buyers are at a loss, and they sell into every bounce trying to break-even. This is one of the mechanical reasons why bounces during a bear market often stalls. On the other hand, crossing this line means that these newer buyers are now sitting on unrealized profits and the line becomes a support zone rather than a ceiling or resistance.
At the time of writing, Bitcoin is around 17% above the STH cost basis. BTC briefly tagged this line back in May this year, only to be rejected and this is the first time in over a year where there is a decent buffer before anyone can say that it’s invalidated.
Ten Months Below the Line and Recent Buyers Are Finally Green
The last time the STH holder cost basis was convincingly reclaimed was in April 2025, a couple of weeks after Bitcoin bottomed near $75K during the tariff selloff. Bitcoin’s price remained above this line through the summer and decisively broke below it after the October 10 liquidation cascade, with every attempt to get back above it failing until last week. That is ten months of recent buyers holding coins worth less than they paid and ten months of that supply hitting the bid on every rally attempt. The case in point being the last attempt in May.
Historically, reclaims of this level cluster around turning points rather than mid-trend. The Look Into Bitcoin chart marks them at the 2019 recovery, the March 2020 crash, mid-2021, the late 2022 lows and again through 2024. That said, marking prior reclaims after the fact is easier than trading the current one, and the sample across a full cycle is small.
The immediate read is behavioral. A cohort that was selling relief rallies four weeks ago is now holding paper gains, and that changes what happens on the next 5% down day.
The 50-Week Moving Average at $81K Is Doing the Rejecting
Bitcoin tagged $81,265 this week. The 50-week moving average sits at $81,063. Price touched it and closed around $2,300 below.
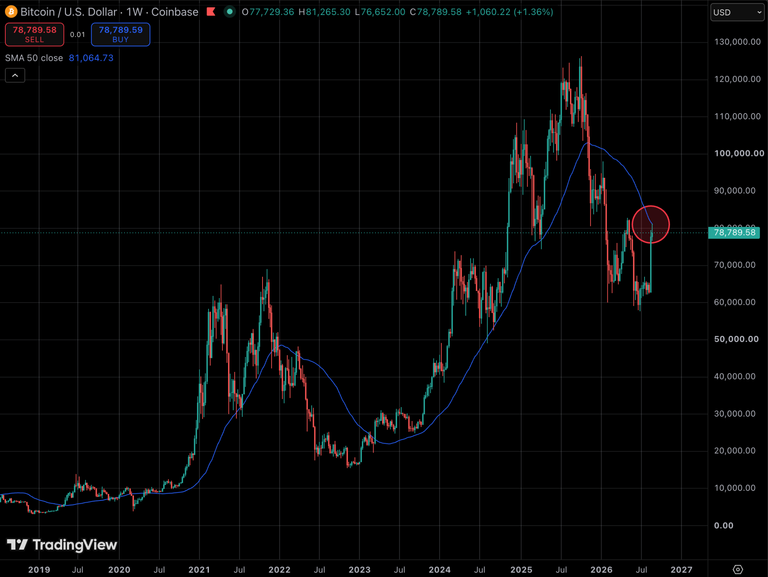
This average has a long record on the weekly chart. It carried price higher through the whole 2024 and 2025 advance, catching pullbacks repeatedly. Once BTC lost it in November 2025, the relationship inverted. It rejected the price in 2018 and did the same through 2022. Both of those were multi-quarter downtrends.
The slope is the second half of the problem. The line has been falling since the November breakdown and is still falling now. A tag and rejection of a downward-sloping long-term average is standard behavior inside a bear structure. It does not become a trend change until the slope flattens out.
What Actually Flips the Bigger Picture
Two separate timeframes are telling two different stories, and both can be true. The short-term trend has flipped, with recent buyers back above water and a level at $67K that should now offer support on the way down.
The longer-term trend has not flipped. That requires a weekly close above $81,063, followed by the average turning sideways rather than continuing lower. Until that happens, this week’s high is a rejection at a known resistance line, and the $67K reclaim is the only structural change on the board.
If you're reading this, you’re already ahead. Stay there with our newsletter.
Recommended Articles


