


Bitcoin Price Forecast: BTC recovery stalls near $80,000 as ETF inflows mount, whale demand strengthens
- Bitcoin hovers above $78,000 on Wednesday, struggling to advance beyond $80,000 after its strongest weekly rise in three years.
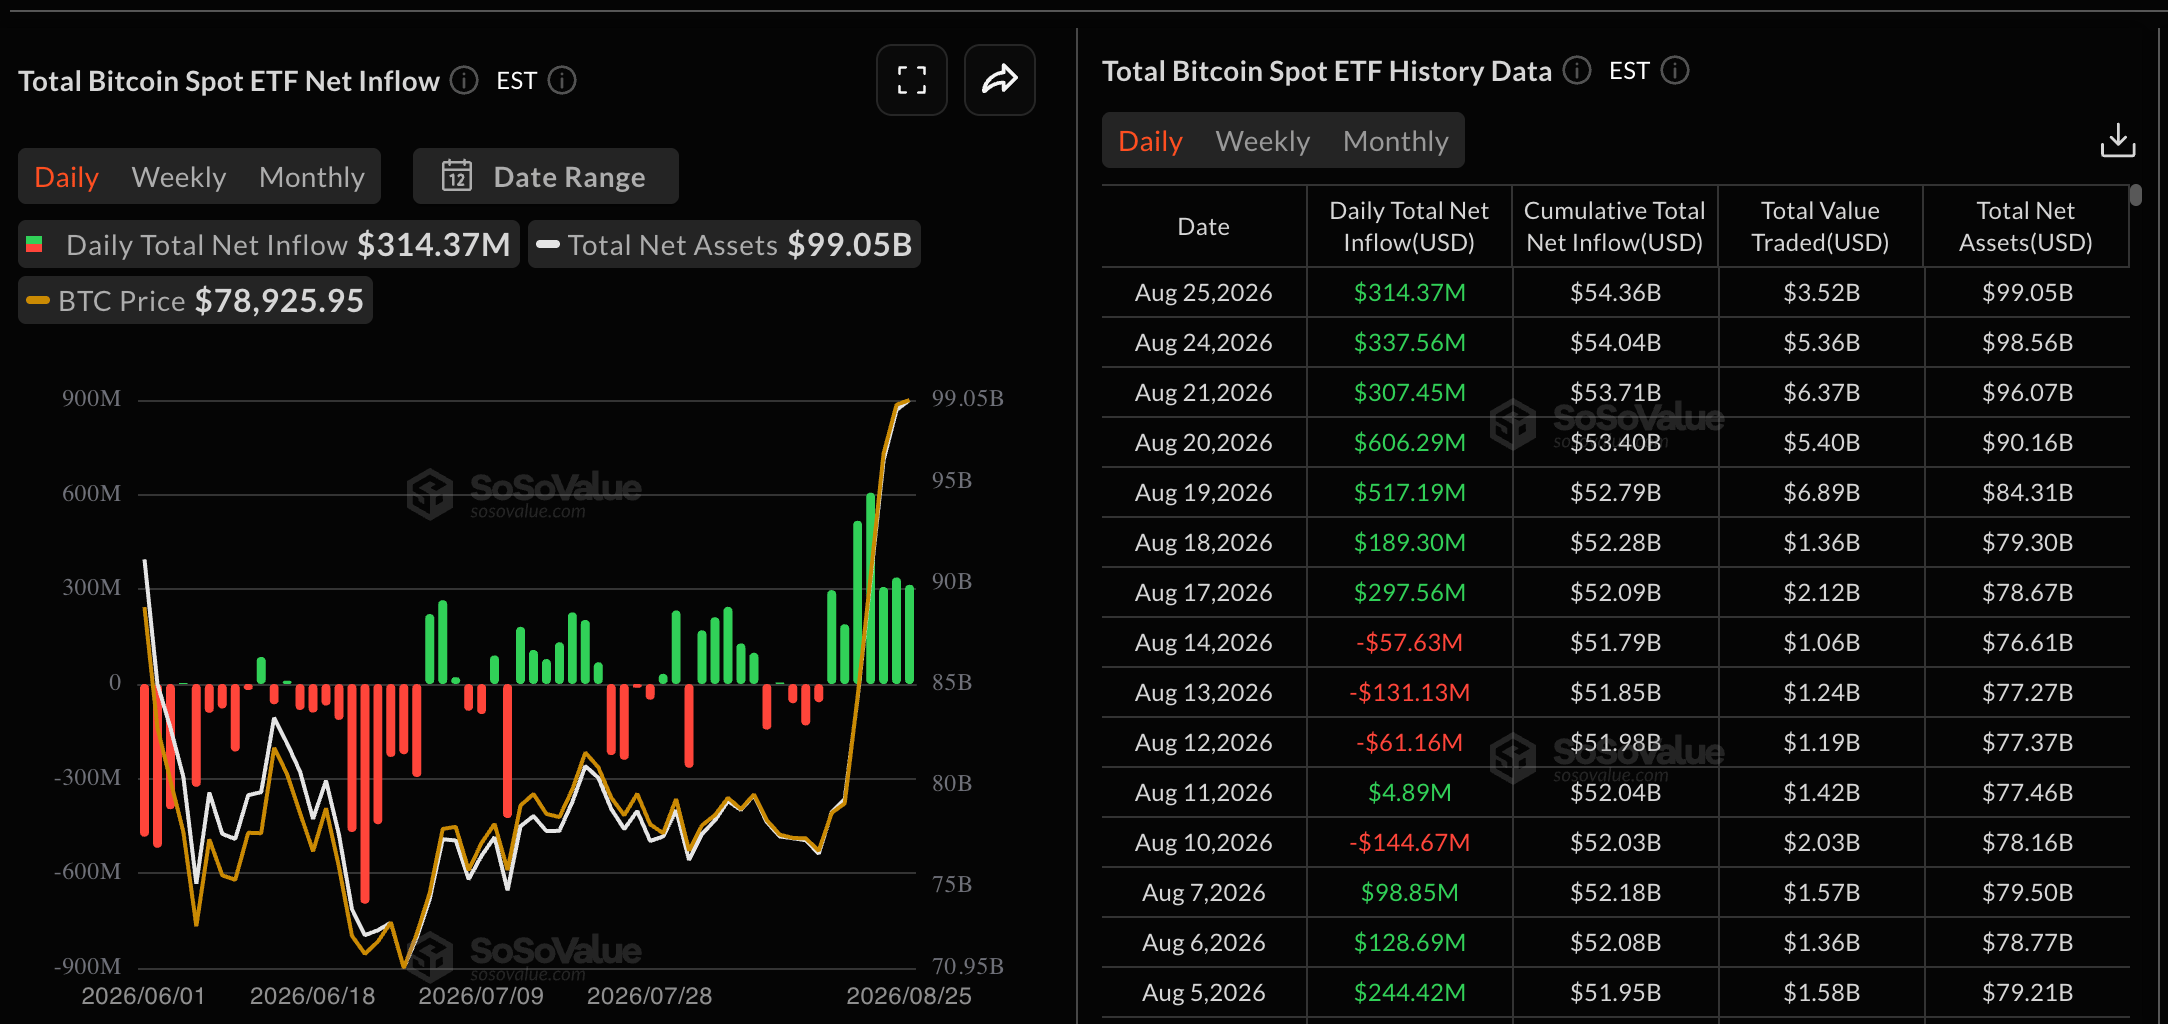
- BTC ETFs recorded their seventh consecutive day of inflows, totaling $314 million on Tuesday, amid whales rotating $5 billion into tax-deferred swaps.
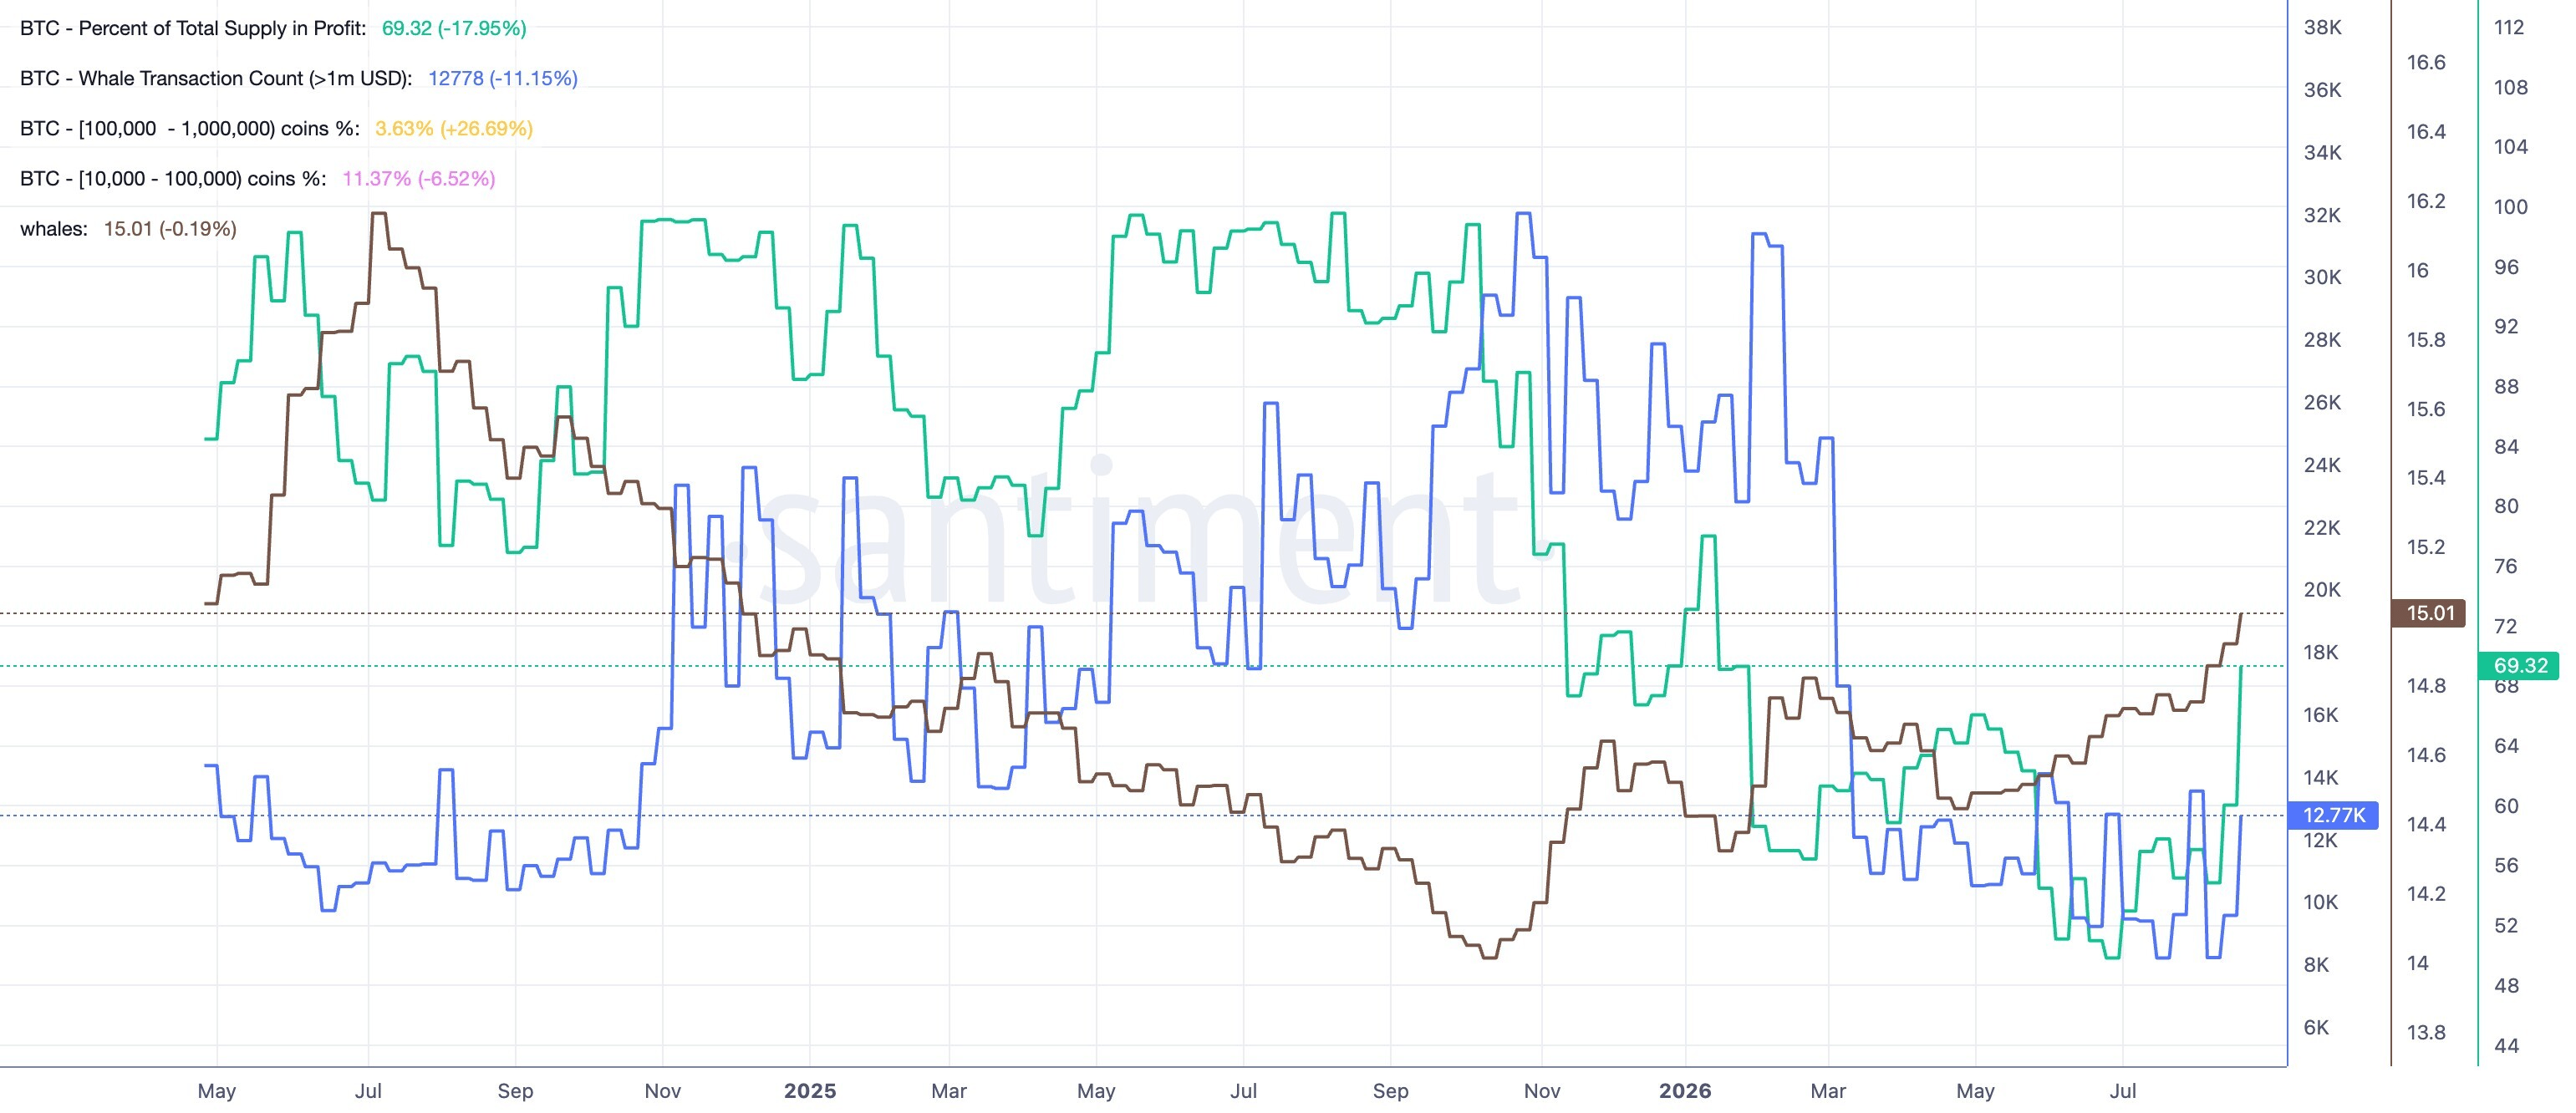
- On-chain data points to rising whale holdings, activity, and total supply in profit, indicating firm buying pressure.
Bitcoin (BTC) price is trading in the green on Wednesday, holding above $78,000 while struggling to extend its recovery above the $80,000 mark. Institutional demand is strengthening, with steady inflows and BlackRock’s tax-deferred Bitcoin-to-ETF swap volume reaching $5 billion. On-chain data points to rising BTC holdings by large-wallet investors, commonly referred to as whales, suggesting increased buying activity.
Bitcoin must clear $80,000 and a swing-high resistance near $82,800 to see a sustained recovery.
BlackRock attracts Bitcoin whales to ETFs amid rising inflows
Eric Balchunas, Senior ETF Analyst at Bloomberg, shared in a recent post on Tuesday that BlackRock has swapped $5 billion of its Bitcoin ETF, IBIT, for BTC holders' tokens. Eric suggests that the recent reduction of the limit on exchanging BTC for IBIT shares to $1 million has fueled swaps, as it makes the option available to whales, not just institutional clients. These in-kind swaps are considered tax-deferred as BTC holders do not realize a taxable gain until they sell their shares.

Institutional demand is also increasing. SoSoValue data shows that BTC ETFs recorded $314.37 million in inflows on Tuesday, marking the seventh consecutive day of positive inflows. The total net asset value has increased to $99.05 billion, accounting for 6.31% of Bitcoin market capitalization.
Taken together, the renewed institutional activity supports Bitcoin's upside potential.
Whales accumulate BTC amid rising supply in profit
Bitcoin’s recent 23% gain marked its strongest rise in the last three years, pushing the price above the average purchase price of many investors. Santiment data shows the percent of total supply in profit rising to 69.32%, from 60.04% on August 13, before the rally. At the same time, the seven-day whale transaction count, with over $1 million in volume, has increased to 12,778, indicating renewed interest from whales.
Whale holdings with 10,000 to 1 million BTC tokens now account for 15.01% of the total supply, up from 14.75% on August 1, indicating a steady rise. Typically, a whale accumulation drive signals either a bottom formation or a steady recovery ahead.
Technical outlook: Bitcoin faces strong headwinds near $80,000
Bitcoin hovers above $78,000 at press time on Wednesday, extending its bullish phase to a three-month high. The King Crypto has surpassed both the 50-day Exponential Moving Average (EMA) at $67,760 and the 200-day EMA at $72,799, suggesting a firmly supported trend structure.
The 78.6% Fibonacci retracement of the downswing from $82,850 to $57,800 at $77,489 adds an additional layer of nearby underlying demand. Bitcoin struggles to sustain gains above $80,000, with the previous swing high at $82,850 providing additional resistance. A confirmed breakout above this zone could target the 127.2% Fibonacci extension level at $89,663.
Momentum readings are stretched on the daily chart, with the Relative Strength Index (RSI) hovering in overbought territory around 80. At the same time, the Moving Average Convergence Divergence (MACD) and signal line remain in positive territory as the bullish histogram profile wanes, hinting at overextended upside pressure.
On the downside, initial support is seen around the recently reclaimed 78.6% retracement at $77,489, followed by a broader demand cluster between the 200-day EMA at $72,799 and the 50% retracement at $70,325.
(The technical analysis of this story was written with the help of an AI tool. Know more.)
Recommended Articles


