

Solana Price Forecast: SOL eyes $100 breakout amid governance voting, renewed ETF inflows

Source Fxstreet
  • Solana edges lower on Monday, holding above $90 after a 27% rise the previous week.
  • SOL-focused ETFs recorded $28.34 million in inflows last week, the highest since mid-May, indicating renewed institutional demand.
  • Solana validator governance has started voting on SGP 1, SGP 2, and SGP 3, which include doubling the disinflation rate to -30%.

Solana (SOL) edges lower to $94 on Monday, following a 27% rebound last week to a two-month high. SOL-focused Exchange Traded Funds (ETFs) recorded four consecutive days of inflows last week, totaling $28.34 million, suggesting renewed institutional buying. Validator voting on multiple proposals started on Monday, which includes doubling the disinflation rate to 30%. 

Solana validator voting begins

Solana validators have begun voting on SGP 1, SGP 2, and SGP 3 proposals, with voting ending Thursday. The SGP 1 protocol addresses the ratification of the Solana Constitution to govern Solana’s network-level decision-making. SGP 2 proposes reducing the inflation rate by increasing the disinflation rate to -15% to -30%. Finally, SGP 3 plans to introduce a fixed base inclusion fee paid to the block leader and a resource fee with a requested transaction cost, which will be burned. 

Taken together, the proposals will restructure on-chain decision-making and reduce pressure on available supply. 
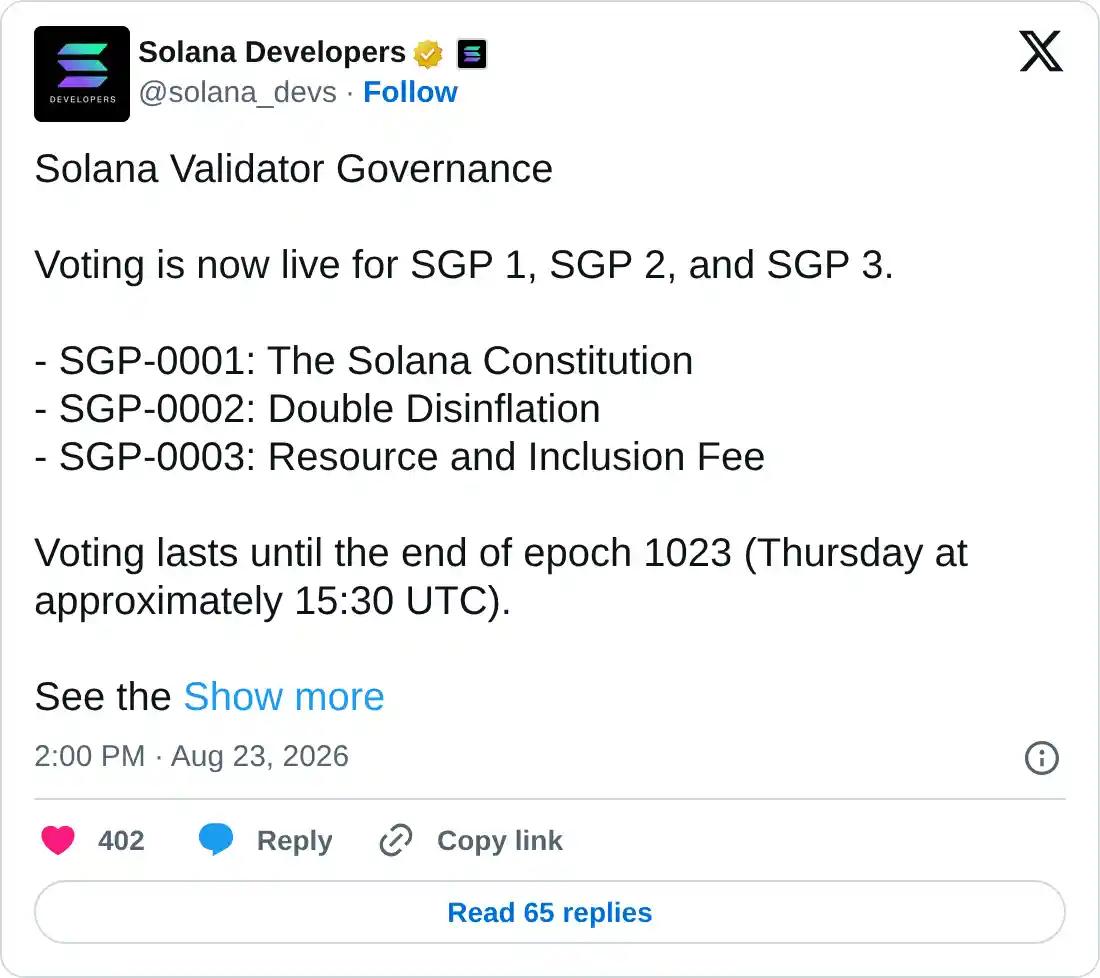
https://x.com/solana_devs/status/2091525961925698024

Solana ETFs regain strength

Solana regains institutional demand. SoSoValue data shows the SOL-focused ETFs recorded $28.34 million in inflows last week, the highest over the last two months. Typically, renewed buying from institutional investors implies a bullish trend reversal. 
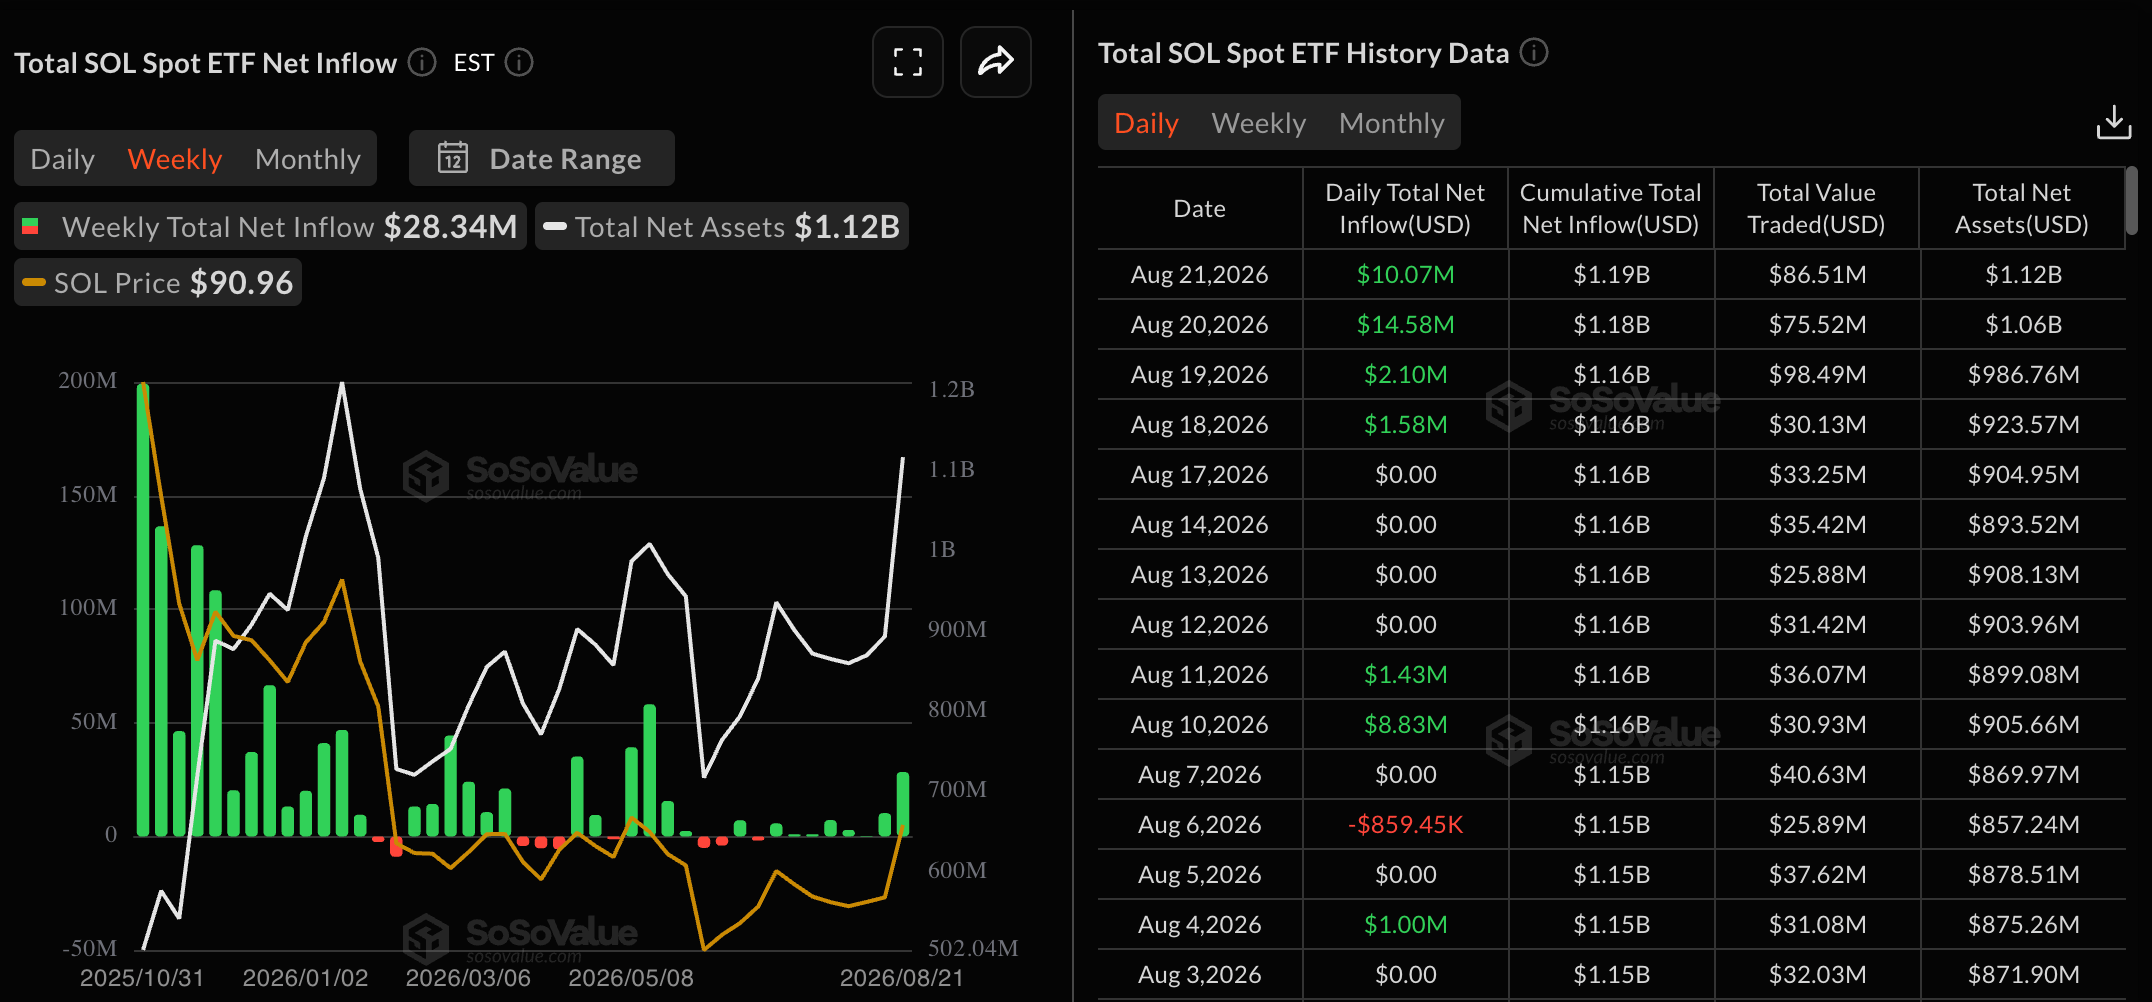
SOL ETFs data. Source: Sosovalue

Technical outlook: Will SOL price cross above $100?

Solana trades around $94 on Monday, holding a bullish near-term bias above both the 50-day Exponential Moving Average (EMA) at $79.04 and the 200-day EMA at $92.67. SOL price remains capped below the $100 psychological level and the May 11 high of $98.41.

For a sustained recovery, SOL should confirm a decisive close above the $100 mark. This could open the path toward the 127.2% Fibonacci extension level of the $98.41 to $60.13 downswing at $112.52.

Momentum stays strong, with the Relative Strength Index (RSI) hovering in overbought territory near 79 on the daily chart. At the same time, the Moving Average Convergence Divergence (MACD) shows a steady upward trend with a positive histogram, suggesting that buying pressure remains dominant.

Chart Analysis SOL/USDT (Binance)
SOL/USDT daily price chart.

On the downside, initial support is seen at the 200-day EMA around $92.67, followed by the 78.6% retracement near $88.56. Deeper declines would expose the 50-day EMA at $79.04 and the 50% retracement at $76.92.

(The technical analysis of this story was written with the help of an AI tool. Know more.)

Disclaimer: For information purposes only. Past performance is not indicative of future results.
placeholder
XRP Price Prediction for July 2026: Can Buyers Finally Break the Downtrend?XRP (XRP) price trades near $1.05, caught between a year-long downtrend and a sudden burst of buying.July has historically rewarded XRP holders. This year the month arrives with on-chain accumulation
Author  Beincrypto
Jun 30, Tue
XRP (XRP) price trades near $1.05, caught between a year-long downtrend and a sudden burst of buying.July has historically rewarded XRP holders. This year the month arrives with on-chain accumulation
placeholder
XAUUSD Gold Analysis: Gold Holds Above $4,350 Ahead of US Inflation Data Is $4,500 Next? Gold holds above $4,350 following weak US jobs data. As inflation reports approach and UBS eyes $5,000, can XAUUSD break resistance at $4,435 to rally toward $4,500?
Author  Naoufal Seddik
Aug 12, Wed
Gold holds above $4,350 following weak US jobs data. As inflation reports approach and UBS eyes $5,000, can XAUUSD break resistance at $4,435 to rally toward $4,500?
placeholder
Gold Price Analysis Today: Gold Drops 1.32% Despite Lower Fed Rate-Hike Bets, Can $4,313 Support Hold? Gold fell 1.32% on August 13 after rising to $4,449.73, then reversing lower and closing near $4,349.918 below the $4,356.46 support. Softer US inflation data reduced Fed rate hike expectations, but selling pressure still dominated the session. Will $4,313 support hold?
Author  Naoufal Seddik
Aug 14, Fri
Gold fell 1.32% on August 13 after rising to $4,449.73, then reversing lower and closing near $4,349.918 below the $4,356.46 support. Softer US inflation data reduced Fed rate hike expectations, but selling pressure still dominated the session. Will $4,313 support hold?
placeholder
Gold Price Analysis Today: Gold Gains 0.94% as Markets Expect Fed to Hold Rates, Can $4,449 Resistance Break? Gold gained 0.94% on August 17, closing near $4,417.30 as softer US data strengthened expectations for unchanged Fed rates in September. Gold remains bullish, with $4,449.730 resistance and $4,310.650 support in focus.
Author  Naoufal Seddik
Aug 18, Tue
Gold gained 0.94% on August 17, closing near $4,417.30 as softer US data strengthened expectations for unchanged Fed rates in September. Gold remains bullish, with $4,449.730 resistance and $4,310.650 support in focus.
placeholder
Gold Price Analysis Today: Gold Rebounds After 1.91% Drop as Yields Ease. Is $4,449 Next? Gold fell about 1.91% on August 18 before producing a strong bullish reaction from the 1-hour demand zone in early August 19 trading. RSI is recovering from oversold conditions, but Supertrend remains bearish as traders await the Fed minutes.
Author  Naoufal Seddik
Aug 19, Wed
Gold fell about 1.91% on August 18 before producing a strong bullish reaction from the 1-hour demand zone in early August 19 trading. RSI is recovering from oversold conditions, but Supertrend remains bearish as traders await the Fed minutes.
Related Instrument
goTop
quote