


Meme Coins Price Prediction: Dogecoin, Shiba Inu, Pepe regain bullish momentum
- Dogecoin rises over 2% above the 50-day EMA at $0.073 on Thursday after rising 7% the previous day.
- Shiba Inu extends gains by almost 5% as momentum shifts bullish.
- Pepe is up by 9%, mimicking the 11% surge seen the previous day.
Meme coins, including Dogecoin (DOGE), Shiba Inu (SHIB), and Pepe (PEPE), are trading in the green on Thursday, extending their previous day’s gains linked to US Treasury bond buybacks. The technical outlook for DOGE, SHIB and PEPE points to a bullish path forward as momentum shifts to the upside.
Technical outlook: Will DOGE, SHIB, and PEPE extend their rally?
Dogecoin trades around $0.0760 at press time on Thursday, extending its 7% rise from the previous day. The meme coin has extended its rebound above the 50-day Exponential Moving Average (EMA) at $0.0735, hinting at a modestly constructive near-term tone. Still, DOGE remains capped below the 100-day EMA at $0.0802 and the longer-term 200-day EMA at $0.0960.
Momentum stays supportive, with the Relative Strength Index (RSI) at 67 on the daily chart, inches closer to the overbought territory. At the same time, the Moving Average Convergence Divergence (MACD) is rising above the signal line, reflecting the upside momentum.
On the topside, initial resistance aligns with the 100-day EMA at $0.0802, ahead of a more meaningful barrier at the February 5 low at $0.0867. A sustained breakout above this level could open the door for a stronger bullish continuation toward the 200-day EMA near $0.0960.
On the downside, immediate support is at the 50-day EMA at $0.0735, where a deeper pullback would be expected to attract dip-buying interest.
Shiba Inu is up 4% on Thursday, advancing its 7% rise from the previous day. SHIB shows a steady recovery above the 23.6% Fibonacci retracement of the downswing from $0.00000670 to $0.00000405 at $0.00000456.
The immediate resistance for SHIB aligns with the 50% retracement at $0.00000521, guarding the upside toward the $0.00000600 round figure.
Momentum shows near-term strength on the daily chart, with the MACD rising above its signal line, indicating a bullish crossover. Meanwhile, the RSI around 56 rises above the midline as buying pressure builds.
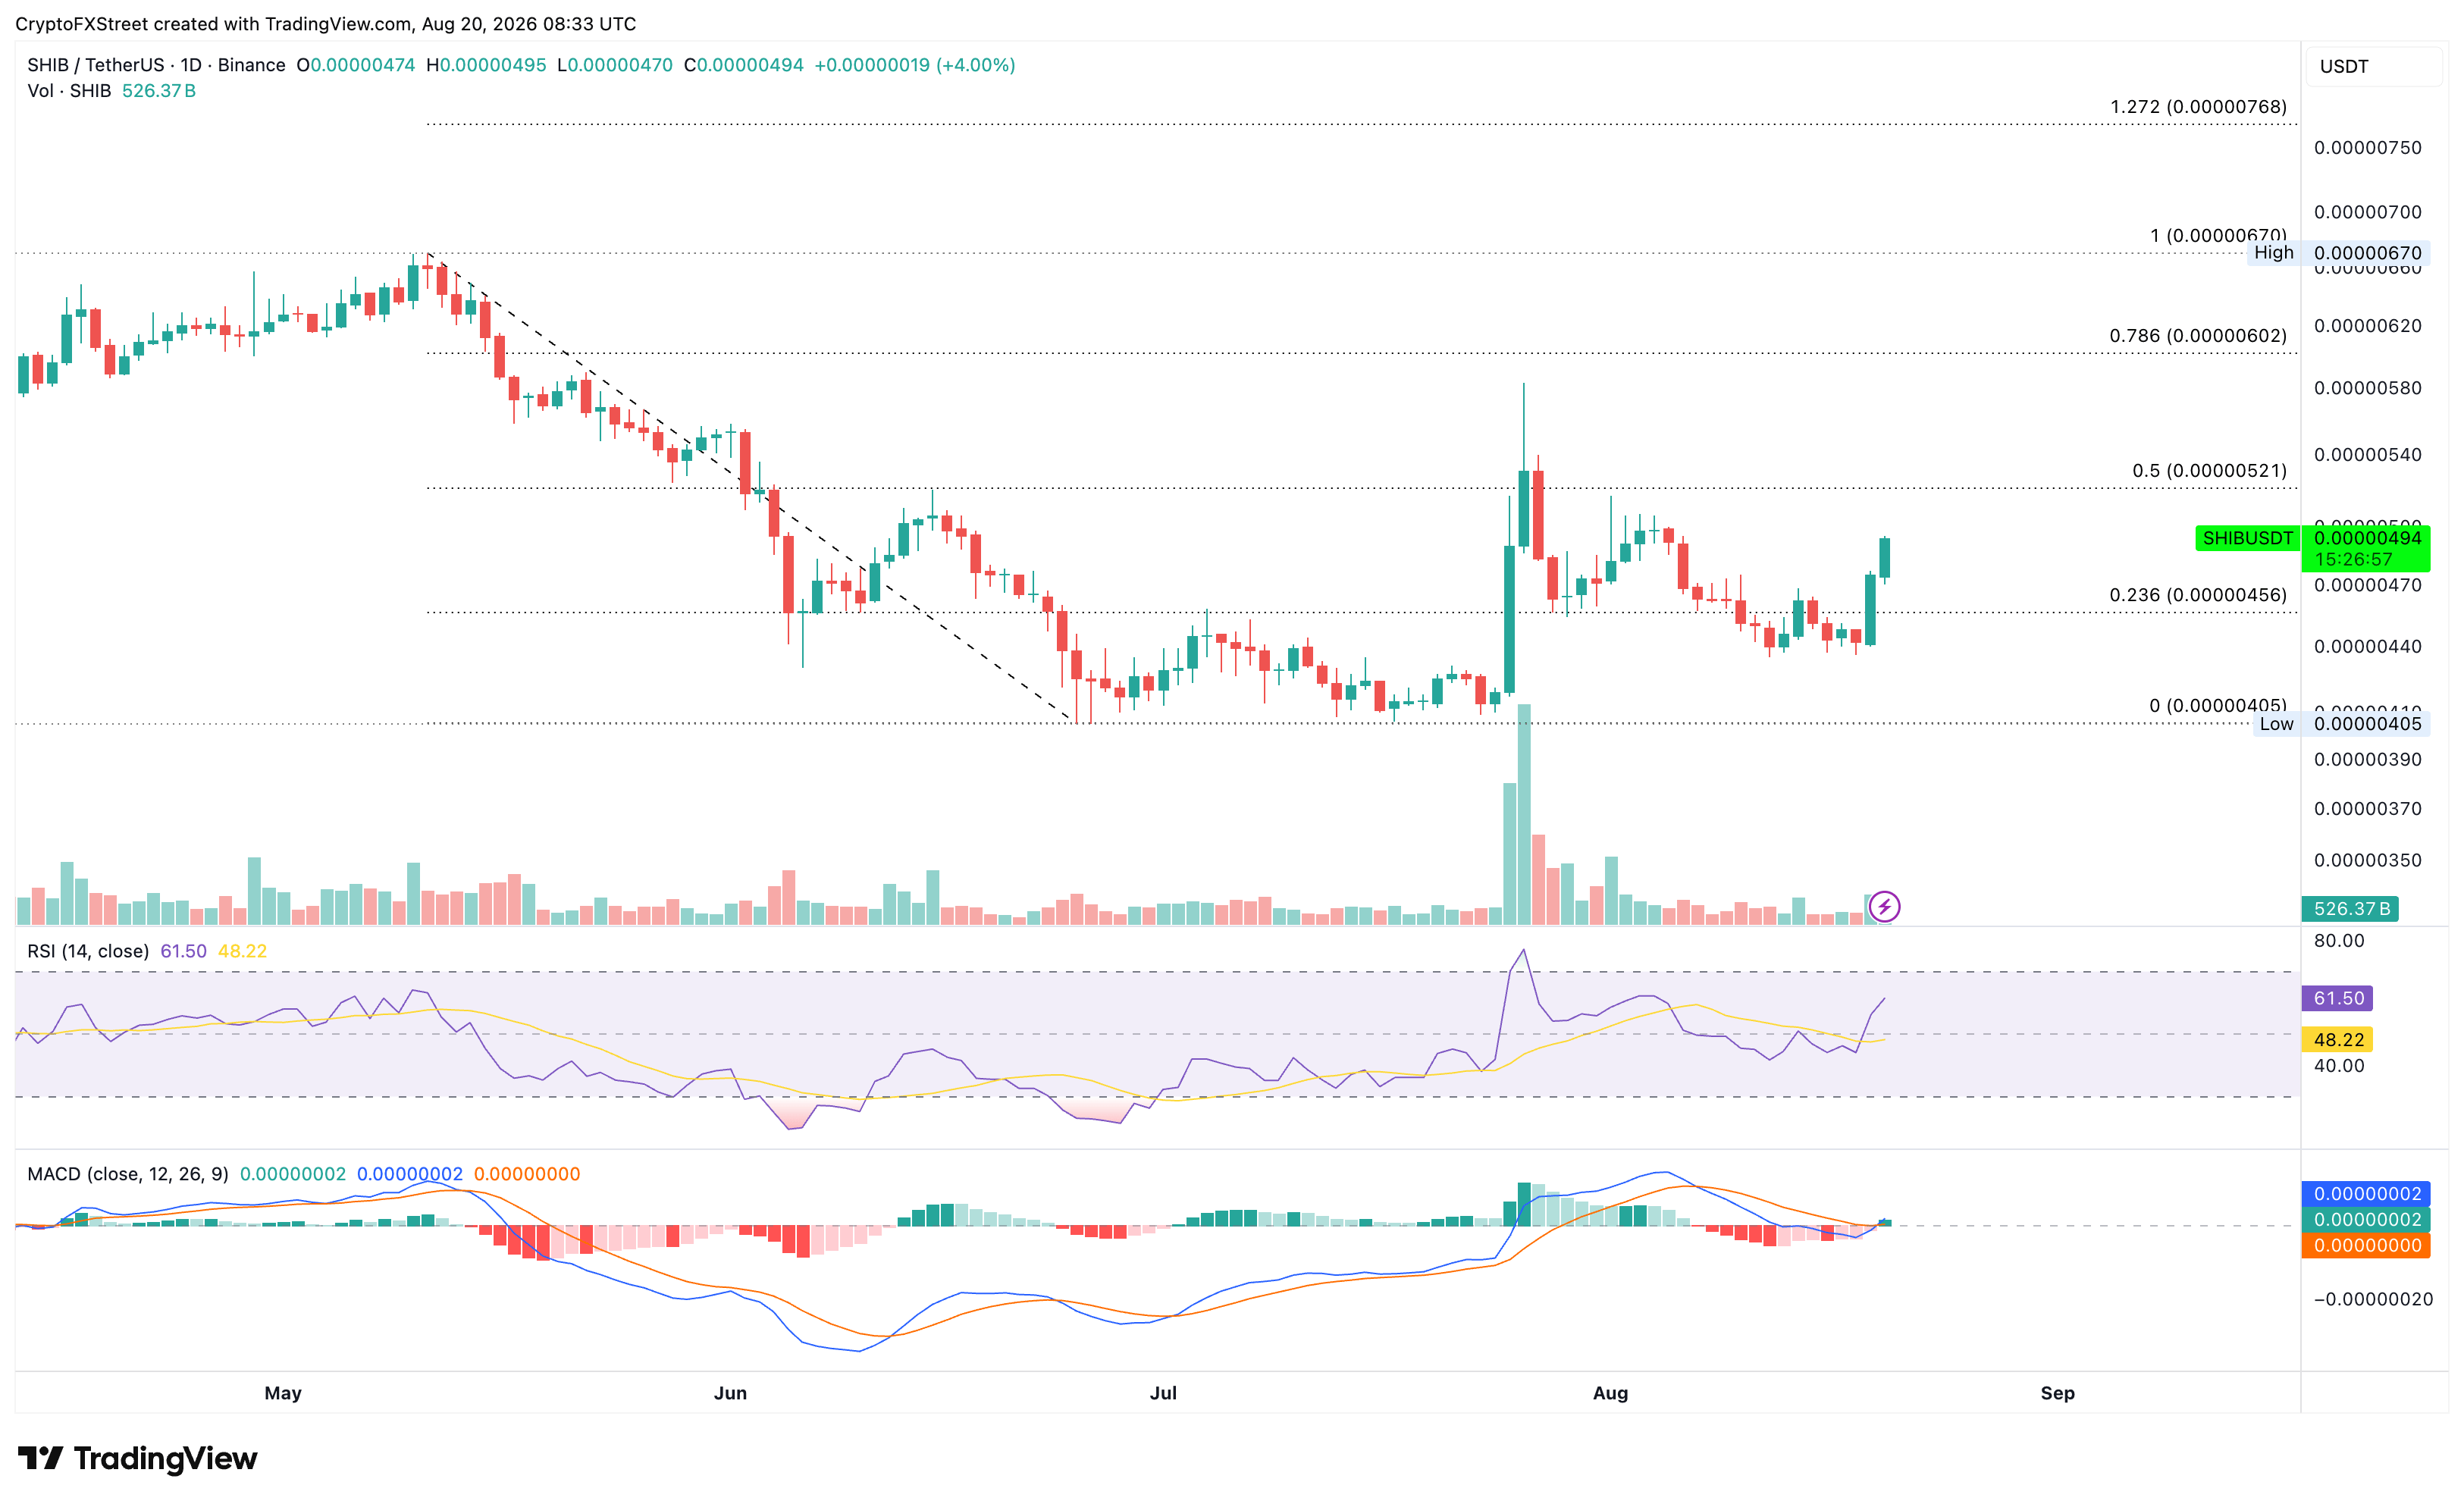
Looking down, the key support for SHIB lies at the 23.6% Fibonacci retracement at $0.00000456.
Pepe outpaces the dog-themed meme coins, with over 9% gains on Thursday, building on its 11% gains from the previous day. The frog-themed meme coin is testing the bullish breakout of the July 15 high at $0.00000314. A decisive close above this level could unlock the rally toward the previous swing highs of May 31 and 21 at $0.00000348 and $0.00000384, respectively.
Momentum signals a mild near-term upside bias, with the RSI at 68 leaning toward the buy side and nearing overbought territory. Meanwhile, the MACD and signal line perform a bullish crossover, indicating renewed upside momentum.
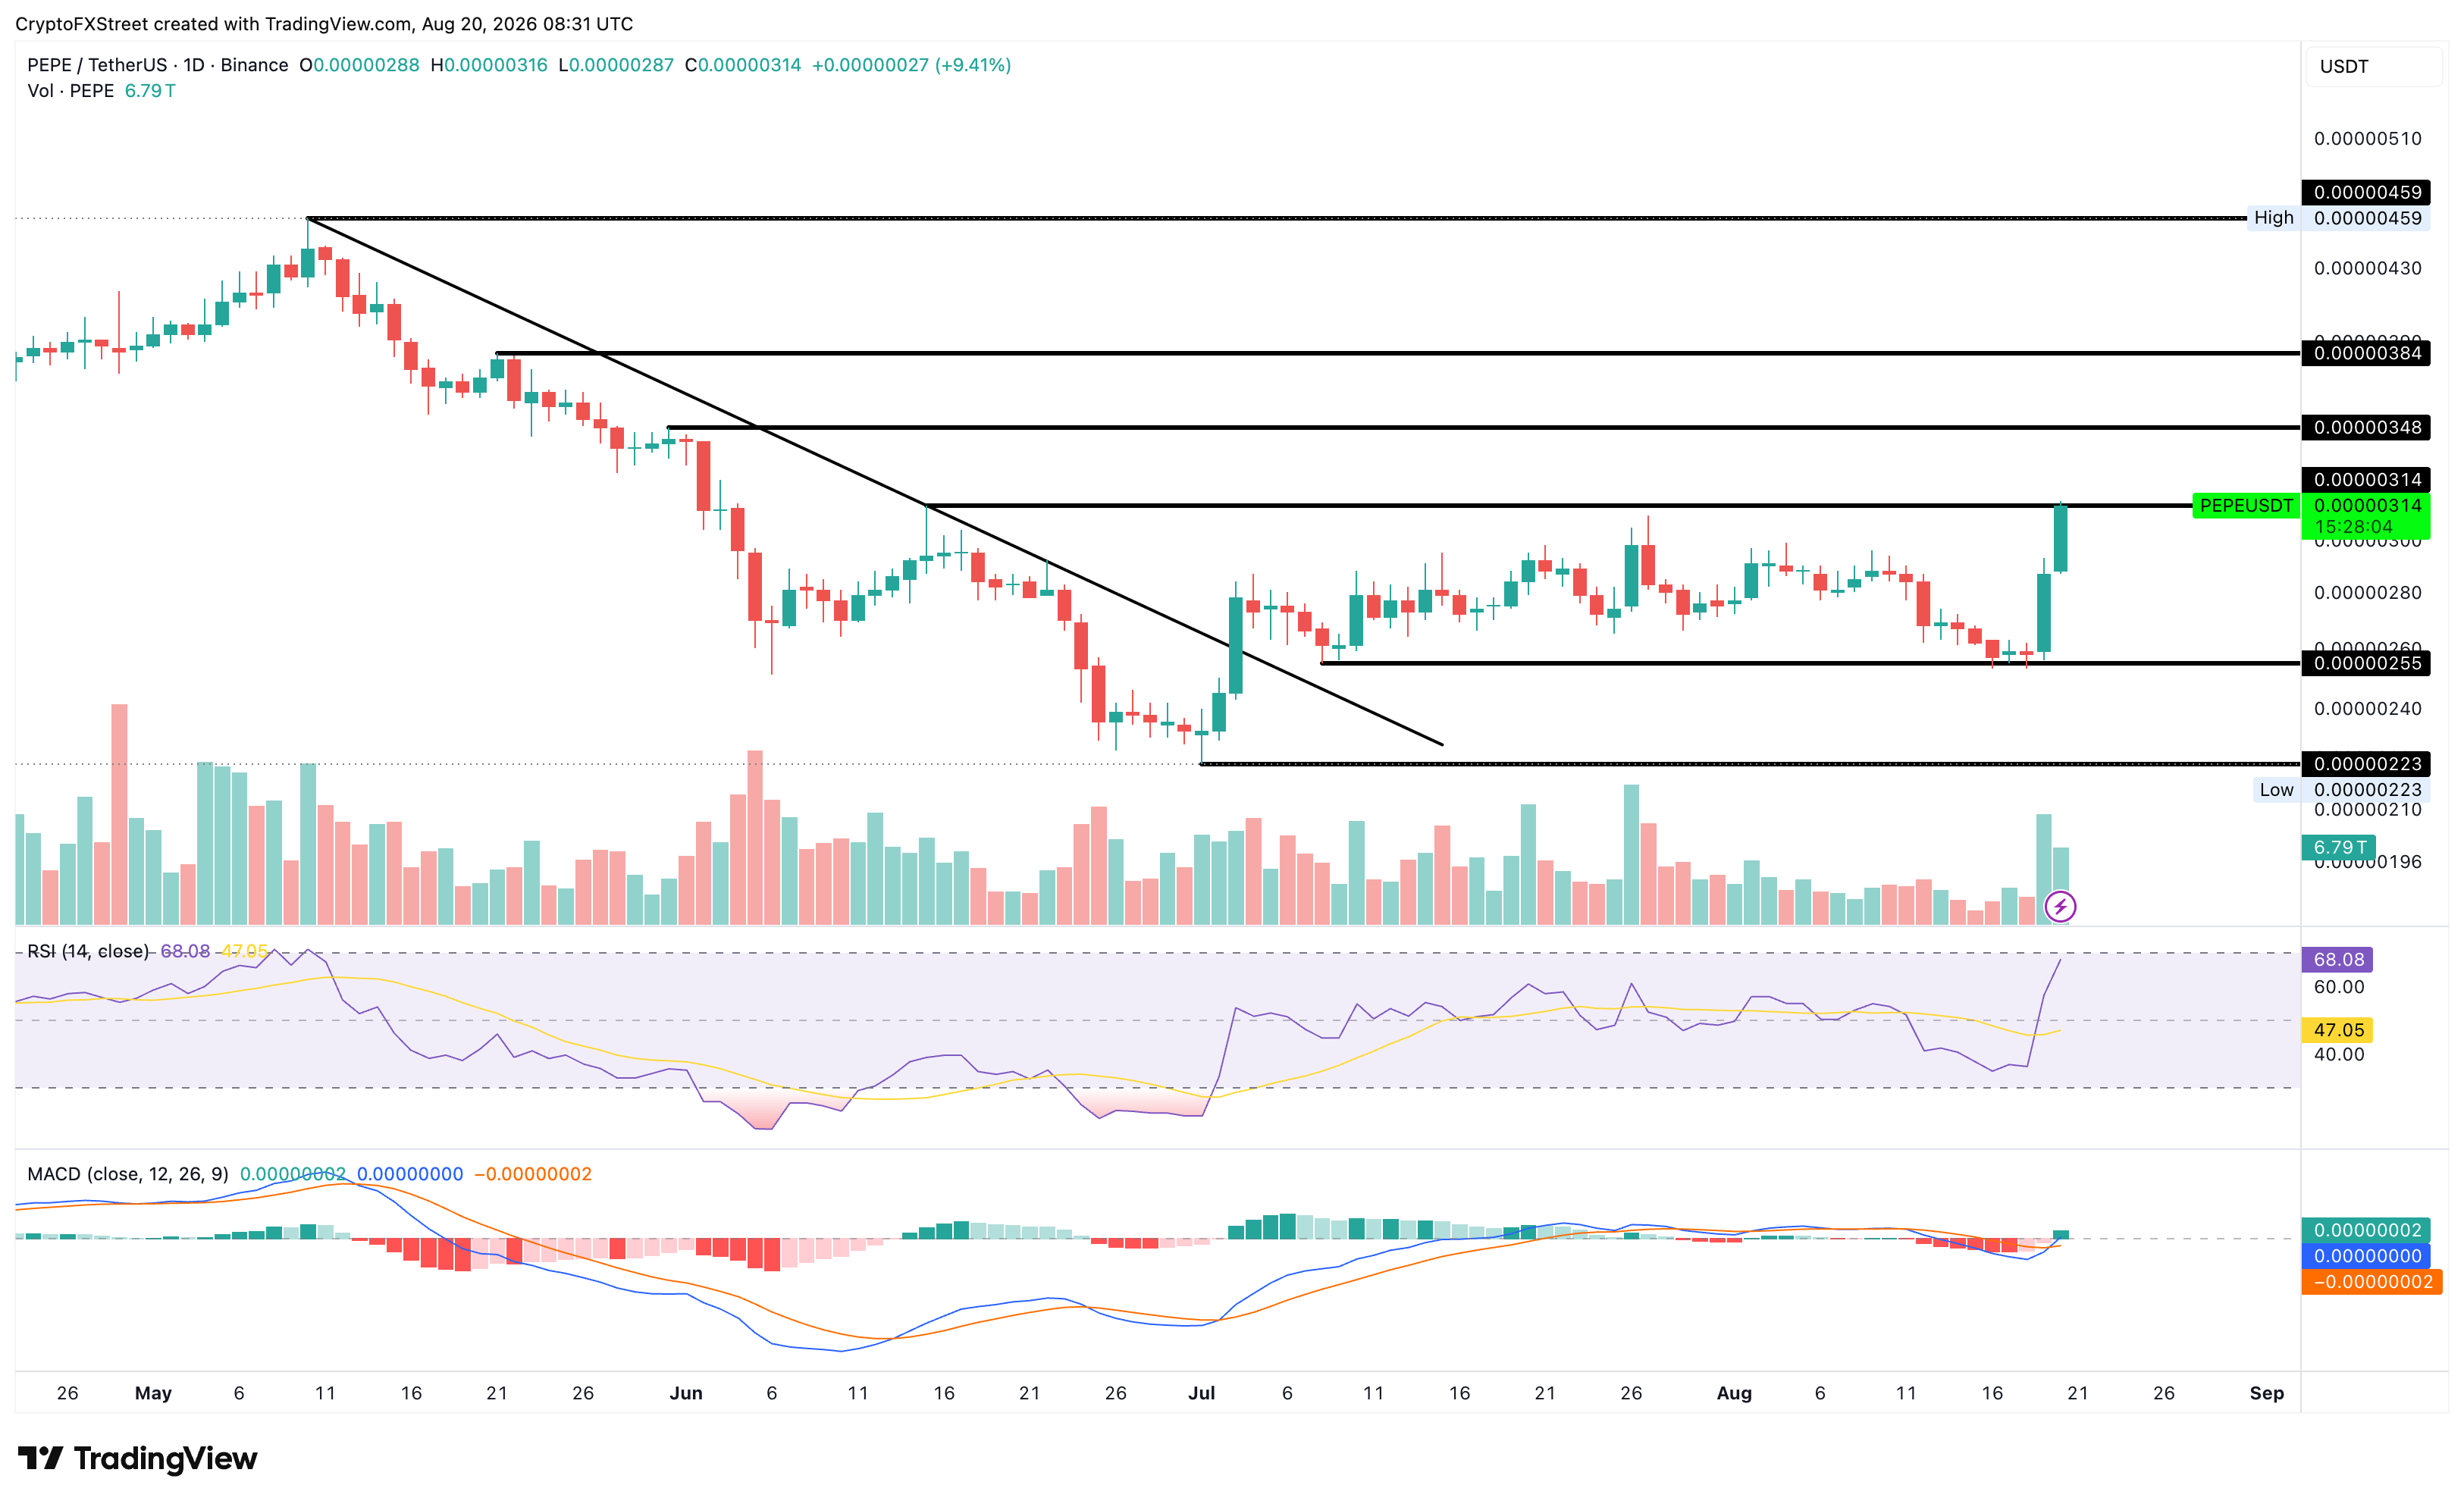
On the downside, the July 8 high at $0.00000255 remains a key support floor, where a pullback could renew buying interest.
(The technical analysis of this story was written with the help of an AI tool. Know more.)
Recommended Articles


