

Pi Network Price Forecast: PI lacks bullish momentum as broader market recovers

Source Fxstreet
  • Pi Network hovers above $0.0890 on Thursday, after three consecutive days of gains.
  • Broader crypto market sentiment improves with the US Treasury bond buyback. 
  • The technical outlook for PI indicates a mild upside bias but lacks decisive momentum.

Pi Network (PI) is trading around $0.0890 at press time on Thursday, sustaining its three-day recovery earlier this week. Renewed risk-on sentiment in the crypto market, with the US Treasury bond buyback, boosts Bitcoin (BTC) toward $70,000, while PI lacks the bullish drive. PI token must clear the $0.1000 psychological threshold for an extended rally.

Pi Network lacks decisive retail strength as broader market rises

The US Treasury said it would at least double the maximum size of its liquidity support for buyback operations, from $2 billion to $4 billion per operation. This effort to curb rising borrowing costs has eased long-term bond yields and lifted investors' confidence in high-risk assets such as cryptocurrencies. 

However, Pi Network remains one of the few underperforming altcoins, lagging behind the broader crypto market recovery. CoinAnk data shows a mild increase in PI retail speculation, with Open Interest rising to $9.30 million from $8.82 million the previous day, but remaining well below the July 15 peak of $12.14 million. 
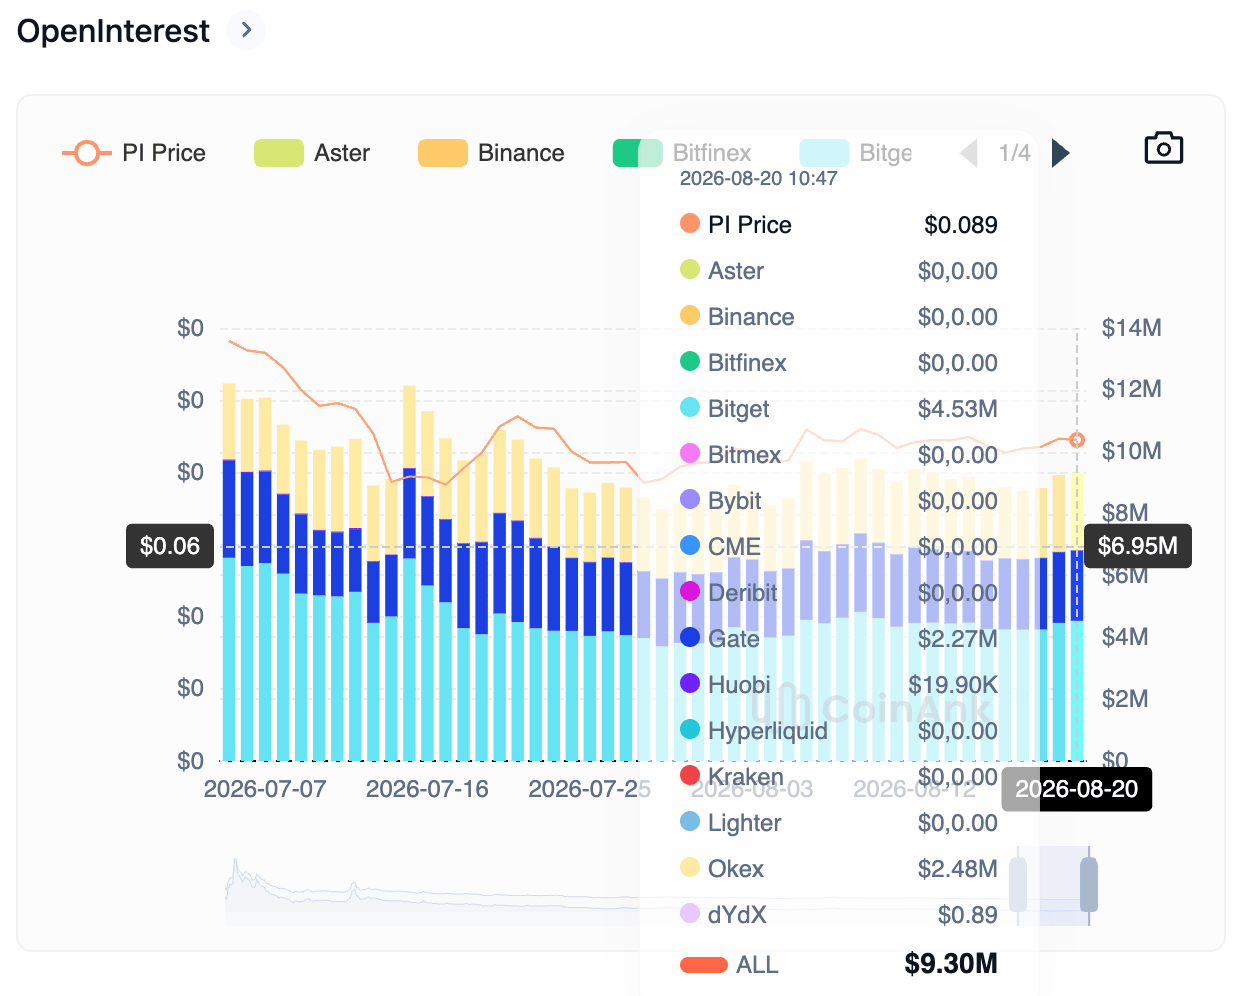
PI token Open Interest chart. Source: CoinAnk

Taken together, Pi Network struggles to capitalize on the brief risk-on sentiment phase in the crypto market, suggesting reduced investor interest. 

Technical outlook: Could PI rebound toward $0.10?

Pi Network trades around $0.0890 on Thursday, keeping a neutral near-term tone. The price continues its steady recovery, with three consecutive bullish daily closes earlier this week, totaling a 4% gain so far.

From a technical perspective, PI shows mild recovery above the 78.6% Fibonacci retracement of the $0.1341 to $0.0703 downswing at $0.0839. The immediate resistance for PI aligns with the 50% retracement at $0.1022.

Momentum is mixed on the daily chart, as the Relative Strength Index (RSI) hovers near the neutral 50 level and the Moving Average Convergence Divergence (MACD) holds marginally above the signal line as the bullish profile expands, hinting at mild upside momentum.
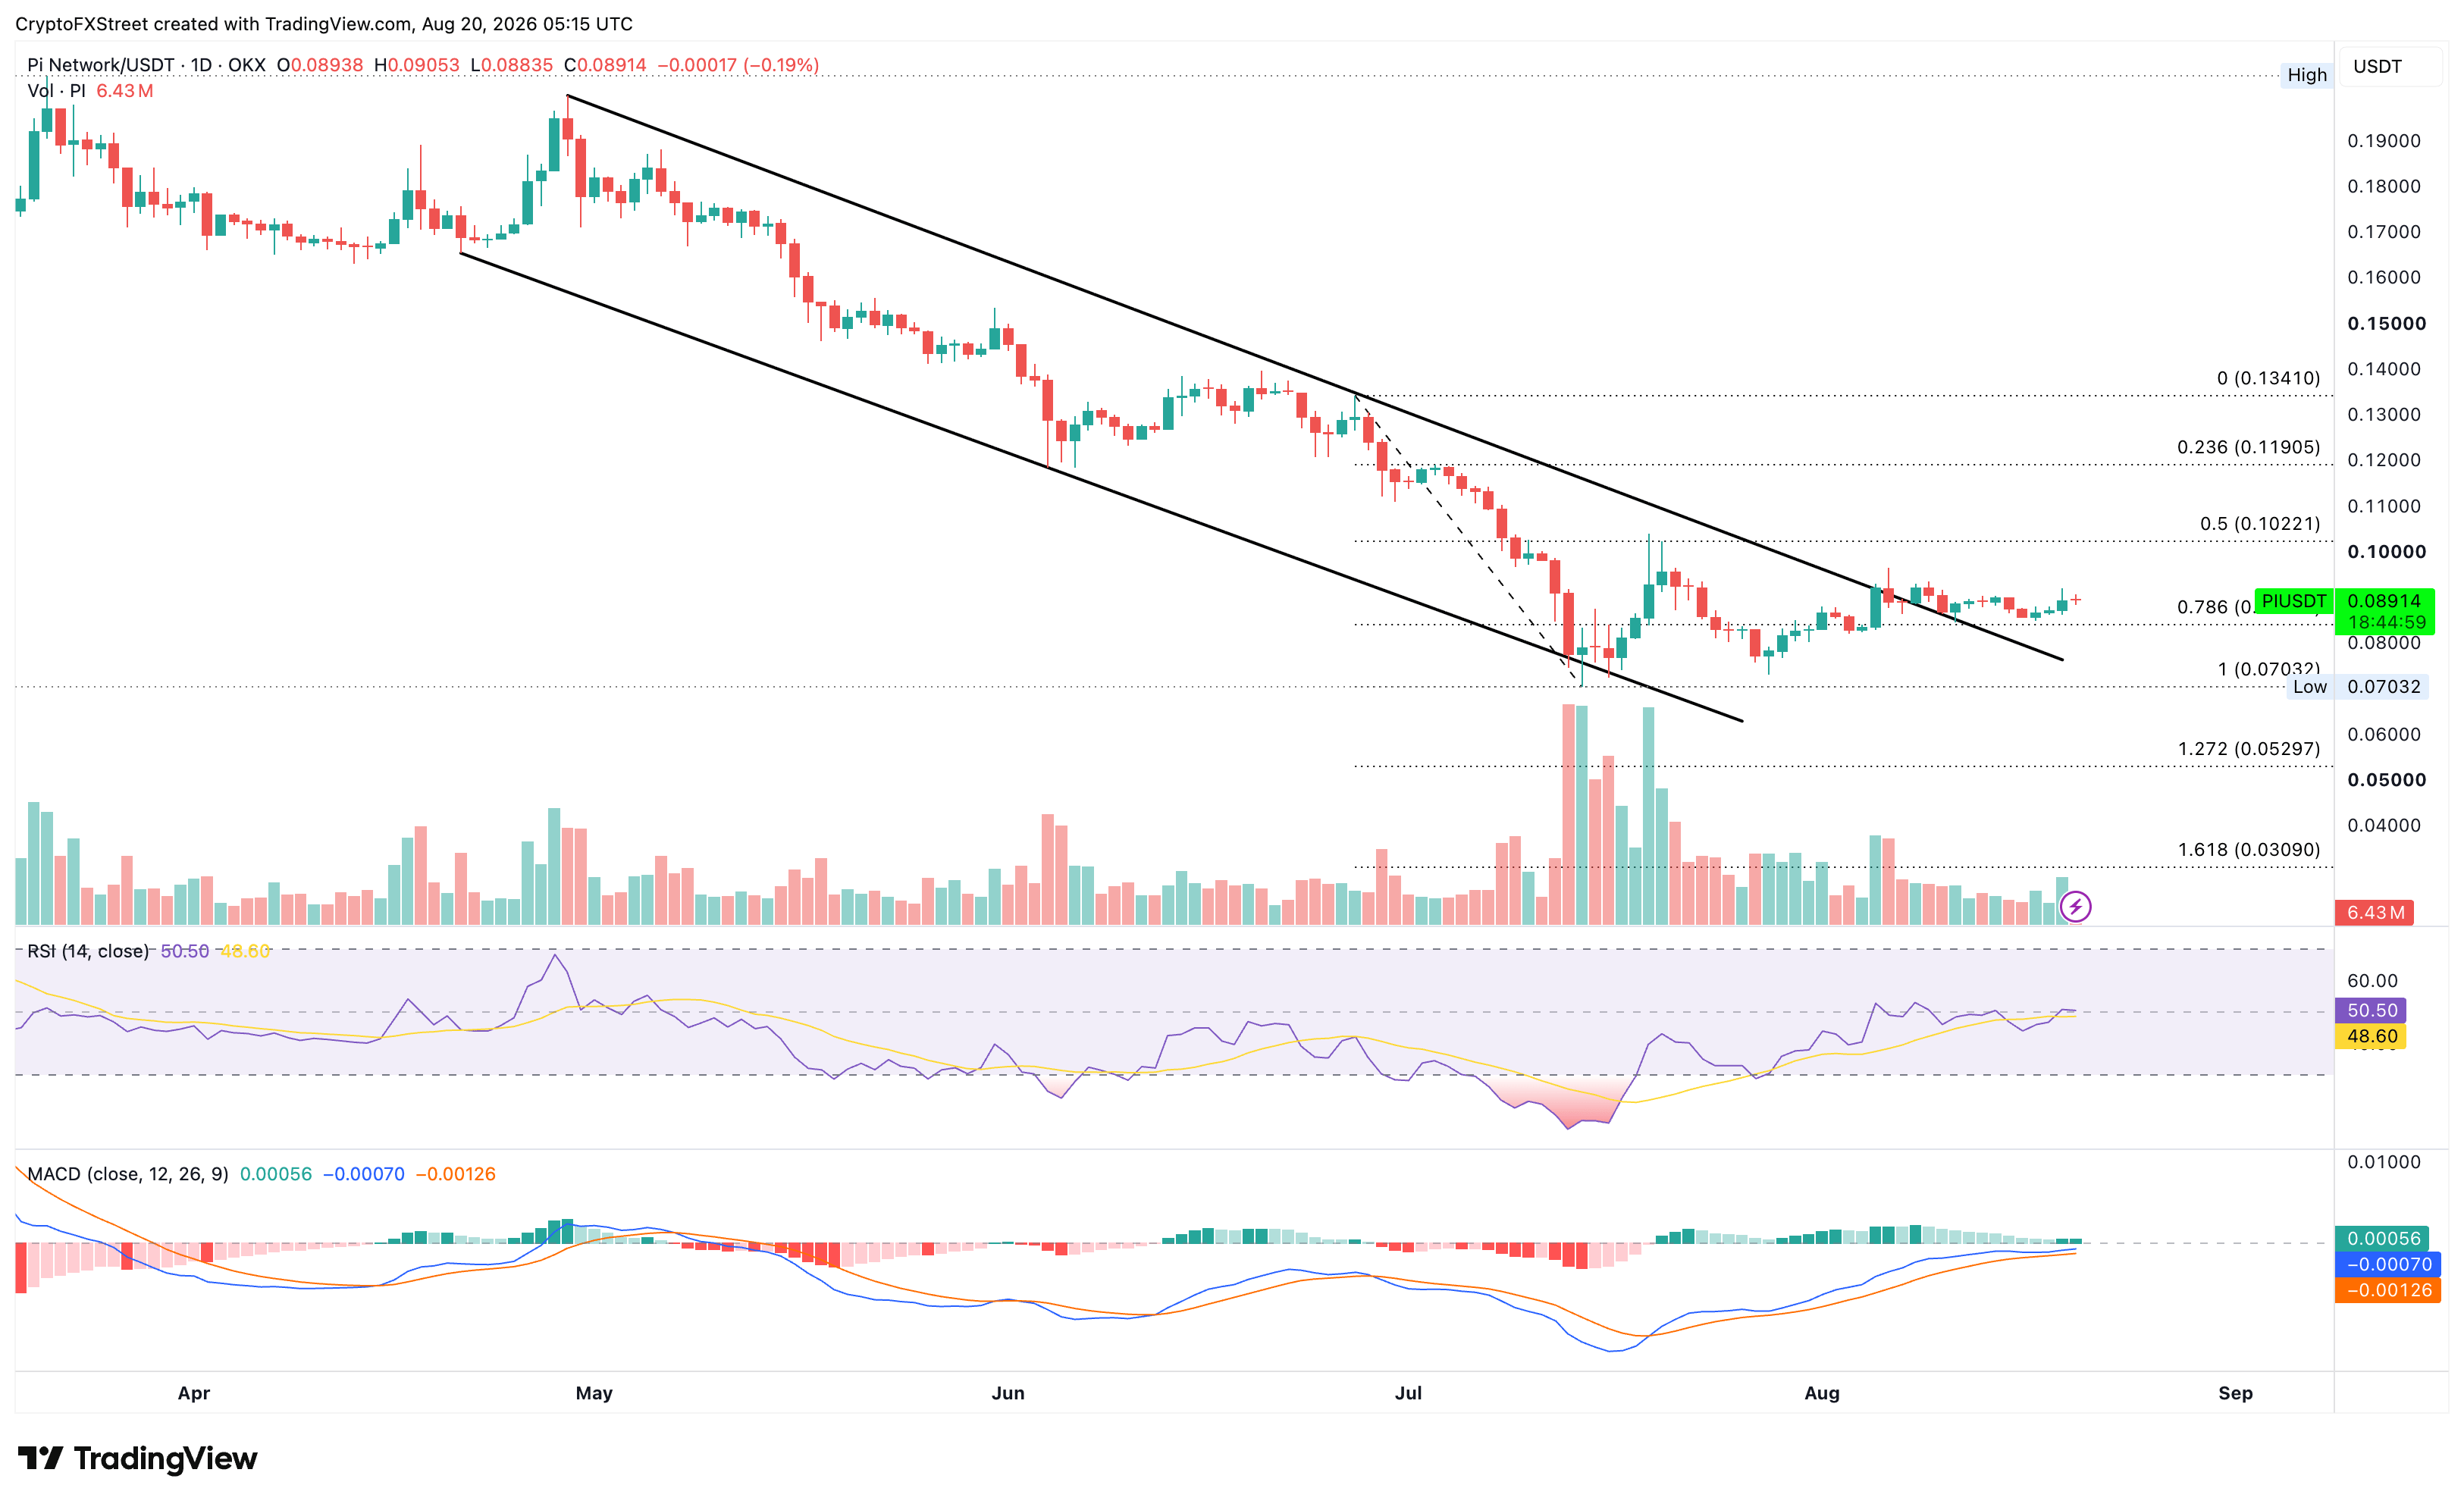
PI/USDT daily price chart.

Looking down, the key support for PI remains the 78.6% Fibonacci retracement level at $0.0839, guarding the downside to the $0.0703 swing low.

(The technical analysis of this story was written with the help of an AI tool. Know more.)

Disclaimer: For information purposes only. Past performance is not indicative of future results.
placeholder
XRP Price Prediction for July 2026: Can Buyers Finally Break the Downtrend?XRP (XRP) price trades near $1.05, caught between a year-long downtrend and a sudden burst of buying.July has historically rewarded XRP holders. This year the month arrives with on-chain accumulation
Author  Beincrypto
Jun 30, Tue
XRP (XRP) price trades near $1.05, caught between a year-long downtrend and a sudden burst of buying.July has historically rewarded XRP holders. This year the month arrives with on-chain accumulation
placeholder
XAUUSD Gold Analysis: Gold Holds Above $4,350 Ahead of US Inflation Data Is $4,500 Next? Gold holds above $4,350 following weak US jobs data. As inflation reports approach and UBS eyes $5,000, can XAUUSD break resistance at $4,435 to rally toward $4,500?
Author  Naoufal Seddik
Aug 12, Wed
Gold holds above $4,350 following weak US jobs data. As inflation reports approach and UBS eyes $5,000, can XAUUSD break resistance at $4,435 to rally toward $4,500?
placeholder
Gold Price Analysis Today: Gold Drops 1.32% Despite Lower Fed Rate-Hike Bets, Can $4,313 Support Hold? Gold fell 1.32% on August 13 after rising to $4,449.73, then reversing lower and closing near $4,349.918 below the $4,356.46 support. Softer US inflation data reduced Fed rate hike expectations, but selling pressure still dominated the session. Will $4,313 support hold?
Author  Naoufal Seddik
Aug 14, Fri
Gold fell 1.32% on August 13 after rising to $4,449.73, then reversing lower and closing near $4,349.918 below the $4,356.46 support. Softer US inflation data reduced Fed rate hike expectations, but selling pressure still dominated the session. Will $4,313 support hold?
placeholder
Gold Price Analysis Today: Gold Gains 0.94% as Markets Expect Fed to Hold Rates, Can $4,449 Resistance Break? Gold gained 0.94% on August 17, closing near $4,417.30 as softer US data strengthened expectations for unchanged Fed rates in September. Gold remains bullish, with $4,449.730 resistance and $4,310.650 support in focus.
Author  Naoufal Seddik
Aug 18, Tue
Gold gained 0.94% on August 17, closing near $4,417.30 as softer US data strengthened expectations for unchanged Fed rates in September. Gold remains bullish, with $4,449.730 resistance and $4,310.650 support in focus.
placeholder
Gold Price Analysis Today: Gold Rebounds After 1.91% Drop as Yields Ease. Is $4,449 Next? Gold fell about 1.91% on August 18 before producing a strong bullish reaction from the 1-hour demand zone in early August 19 trading. RSI is recovering from oversold conditions, but Supertrend remains bearish as traders await the Fed minutes.
Author  Naoufal Seddik
Yesterday 06: 08
Gold fell about 1.91% on August 18 before producing a strong bullish reaction from the 1-hour demand zone in early August 19 trading. RSI is recovering from oversold conditions, but Supertrend remains bearish as traders await the Fed minutes.
goTop
quote