

Zcash: Mining difficulty hits record high as Cypherpunk joins the race

Source Fxstreet
  • Zcash network difficulty recorded an all-time high of 259.69 million on Wednesday, implying increased mining activity.
  • Cypherpunk releases 4.2 GSol/s of Zcash mining power after a $33 million equity deal with Winklevoss Capital.
  • Zcash technical outlook is mixed as the price approaches the apex of a symmetrical triangle pattern.

Zcash (ZEC) hovers above $500 on Wednesday amid record-high mining difficulty, with Cypherpunk Technologies (CYPH) launching its Zcash mining fleet. Network difficulty has hit an all-time high of 259.69 million, which aligns with the release of Cypherpunk’s 4.2 GSol/s Zcash mining fleet. Zcash must surpass the declining resistance trendline near $535 for a sustained rally.

Cypherpunk joins the Zcash race

Cypherpunk has launched a large-scale Zcash mining operation, deploying 4.2 GSol/s of Equihash hashrate, using Bitmain Z15 Pro machines. The new fleet now captures 18% of the network's hashrate, emerging as the top ZEC miner. In addition, Cypherpunk’s entry has increased mining activity on the network, pushing the difficulty to a record high of 259.69 million on Wednesday. 
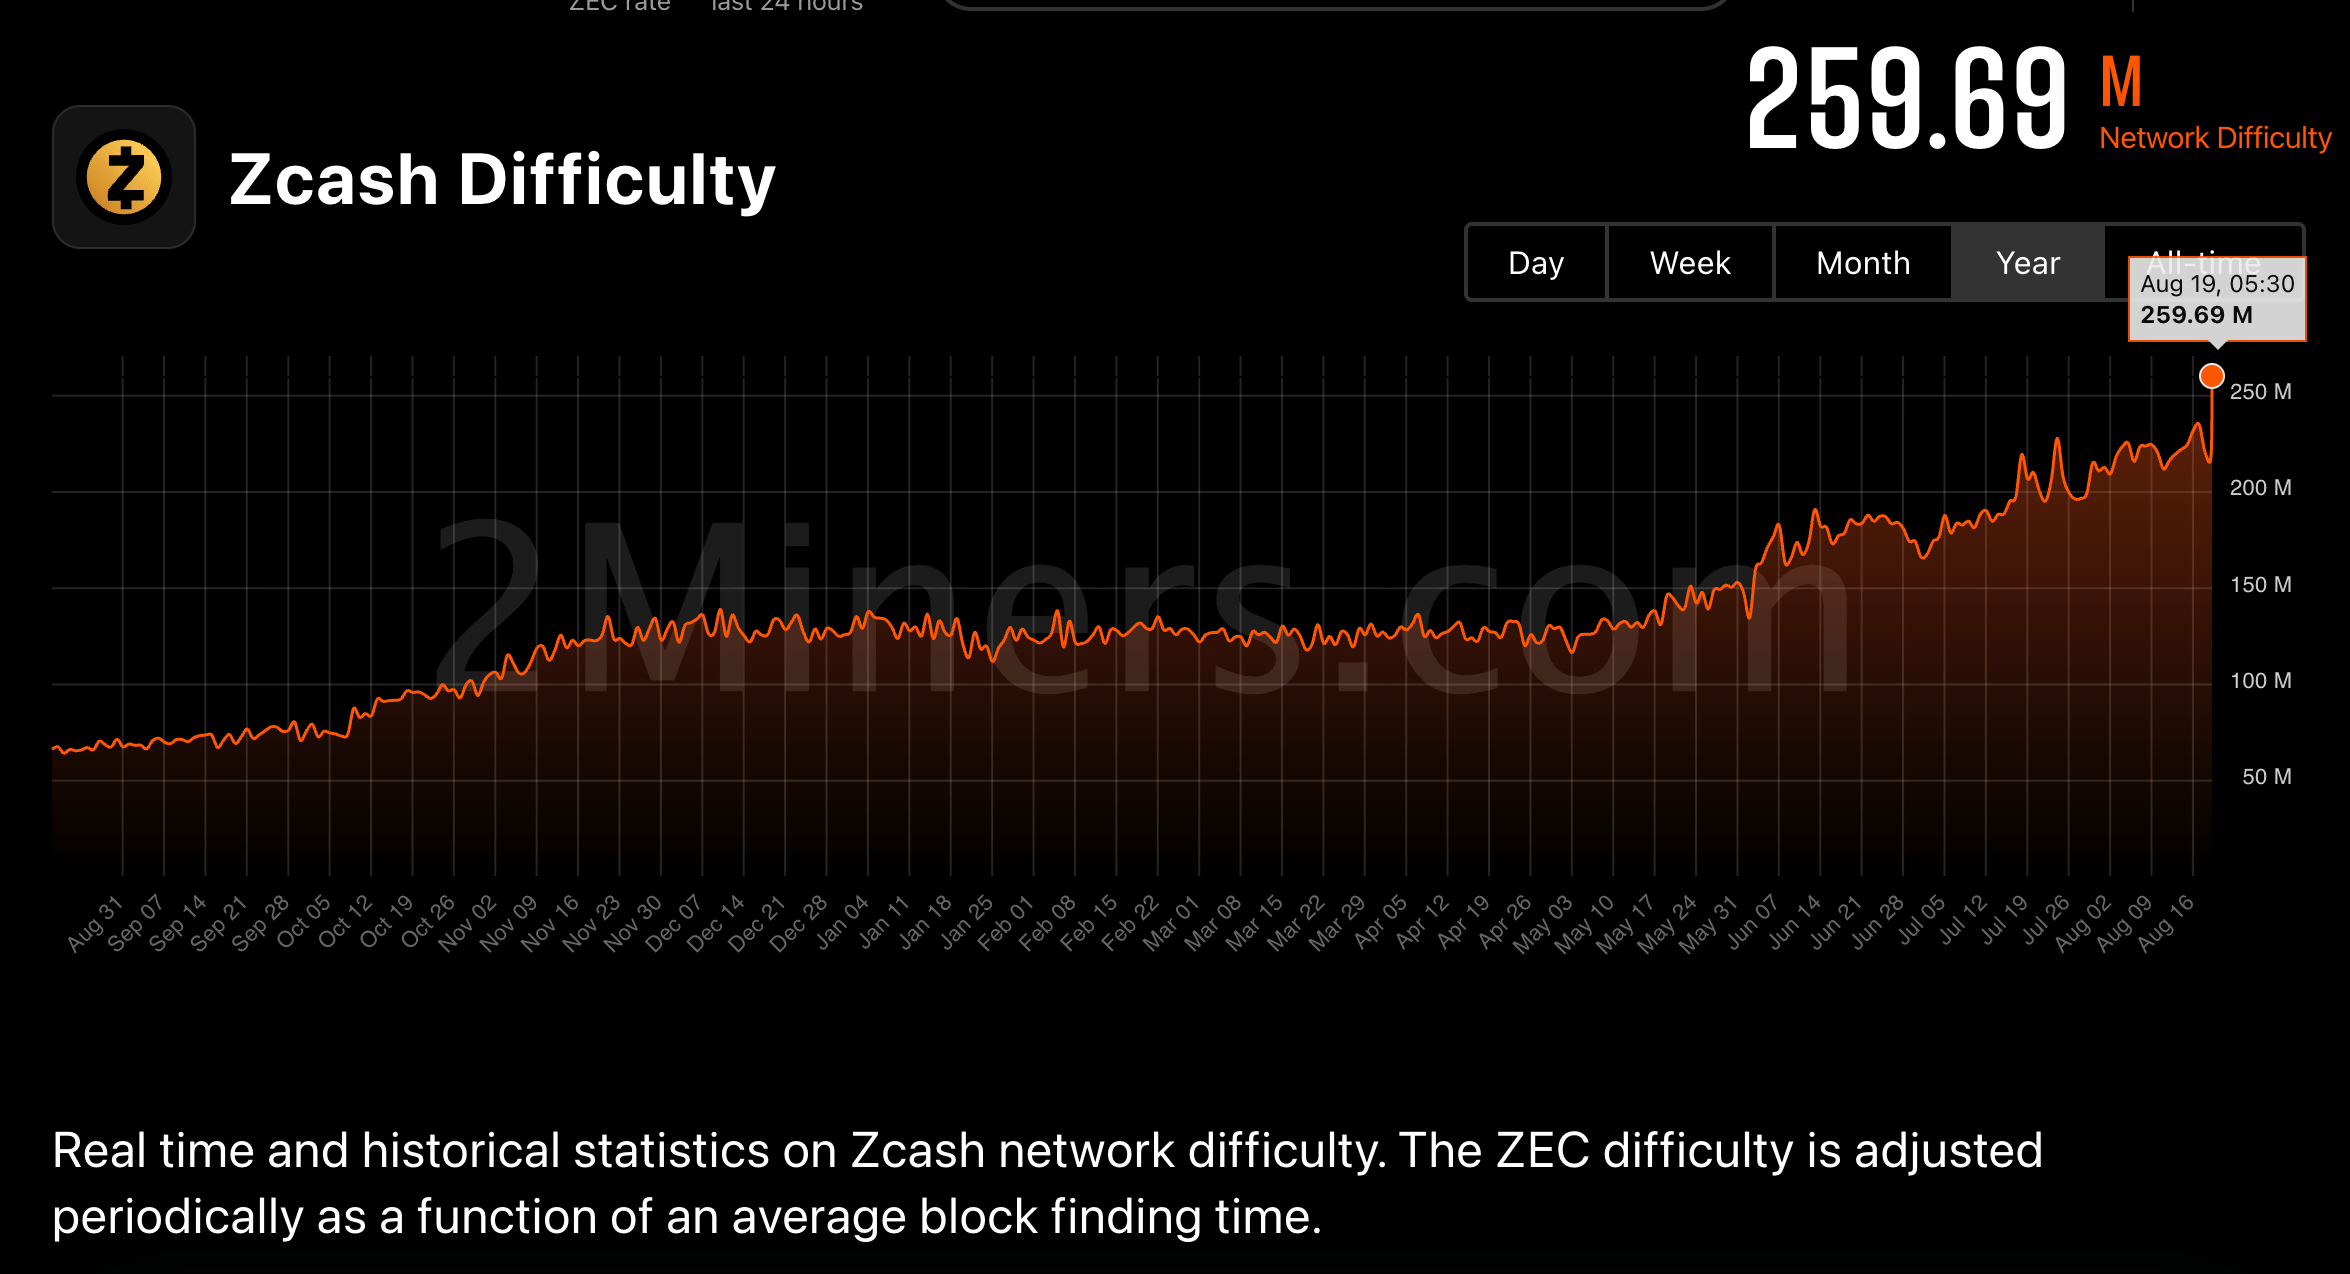
Zcash mining difficulty. Source: 2Miners

Cypherpunk's ZEC mining follows the recent $33.33 million equity deal with the Winklevoss twins, in which it exchanged 43.29 million shares. The company already holds approximately 323,394 ZEC, accounting for 1.92% of Zcash's circulating supply, and aims to expand its treasury to 5%, with mining expected to produce roughly 7,800 ZEC per month.

Technical outlook: Could Zcash trigger a fresh rally?

Zcash holds above $500 at press time on Wednesday, maintaining a constructive near‑term bullish bias as it remains above the 50‑day Exponential Moving Average (EMA) at $491 and well over the 200‑day EMA at $421. From a technical perspective, the ZEC price contracts between two converging trendlines, forming a symmetrical triangle pattern on the daily chart.

Momentum remains mostly neutral on the daily timeframe, with the Moving Average Convergence Divergence (MACD) slightly above the zero line, hinting at modest positive momentum. At the same time, the Relative Strength Index (RSI) around 53 suggests steady, neutral‑to‑bullish conditions.

On the topside, the declining resistance trendline, with the key break price at $535, forms immediate resistance, followed by the R1 and R2 Pivot levels at $569 and $680, respectively, as overhead bullish targets.

Chart Analysis ZEC/USDT (Binance)
ZEC/USDT daily price chart.

On the downside, the 50‑day EMA at $491 provides the first layer of support, close to the rising trendline, ahead of the more distant structural floor defined by the 200‑day EMA near $421, which underpins the broader bullish trend as long as daily closes stay above it.

(The technical analysis of this story was written with the help of an AI tool. Know more.)

Disclaimer: For information purposes only. Past performance is not indicative of future results.
placeholder
XRP Price Prediction for July 2026: Can Buyers Finally Break the Downtrend?XRP (XRP) price trades near $1.05, caught between a year-long downtrend and a sudden burst of buying.July has historically rewarded XRP holders. This year the month arrives with on-chain accumulation
Author  Beincrypto
Jun 30, Tue
XRP (XRP) price trades near $1.05, caught between a year-long downtrend and a sudden burst of buying.July has historically rewarded XRP holders. This year the month arrives with on-chain accumulation
placeholder
XAUUSD Gold Analysis: Gold Holds Above $4,350 Ahead of US Inflation Data Is $4,500 Next? Gold holds above $4,350 following weak US jobs data. As inflation reports approach and UBS eyes $5,000, can XAUUSD break resistance at $4,435 to rally toward $4,500?
Author  Naoufal Seddik
Aug 12, Wed
Gold holds above $4,350 following weak US jobs data. As inflation reports approach and UBS eyes $5,000, can XAUUSD break resistance at $4,435 to rally toward $4,500?
placeholder
Gold Price Analysis Today: Gold Drops 1.32% Despite Lower Fed Rate-Hike Bets, Can $4,313 Support Hold? Gold fell 1.32% on August 13 after rising to $4,449.73, then reversing lower and closing near $4,349.918 below the $4,356.46 support. Softer US inflation data reduced Fed rate hike expectations, but selling pressure still dominated the session. Will $4,313 support hold?
Author  Naoufal Seddik
Aug 14, Fri
Gold fell 1.32% on August 13 after rising to $4,449.73, then reversing lower and closing near $4,349.918 below the $4,356.46 support. Softer US inflation data reduced Fed rate hike expectations, but selling pressure still dominated the session. Will $4,313 support hold?
placeholder
Gold Price Analysis Today: Gold Gains 0.94% as Markets Expect Fed to Hold Rates, Can $4,449 Resistance Break? Gold gained 0.94% on August 17, closing near $4,417.30 as softer US data strengthened expectations for unchanged Fed rates in September. Gold remains bullish, with $4,449.730 resistance and $4,310.650 support in focus.
Author  Naoufal Seddik
Yesterday 07: 02
Gold gained 0.94% on August 17, closing near $4,417.30 as softer US data strengthened expectations for unchanged Fed rates in September. Gold remains bullish, with $4,449.730 resistance and $4,310.650 support in focus.
placeholder
Gold Price Analysis Today: Gold Rebounds After 1.91% Drop as Yields Ease. Is $4,449 Next? Gold fell about 1.91% on August 18 before producing a strong bullish reaction from the 1-hour demand zone in early August 19 trading. RSI is recovering from oversold conditions, but Supertrend remains bearish as traders await the Fed minutes.
Author  Naoufal Seddik
3 hours ago
Gold fell about 1.91% on August 18 before producing a strong bullish reaction from the 1-hour demand zone in early August 19 trading. RSI is recovering from oversold conditions, but Supertrend remains bearish as traders await the Fed minutes.
goTop
quote