

Shiba Inu Price Forecast: SHIB recovery hinges on key support

Source Fxstreet
  • Shiba Inu recovers slightly, trading at $0.0000044 on Wednesday, after finding support around the critical level.
  • Rising social dominance, positive funding rates, and rising long positions highlight improving market sentiment.
  • The technical outlook suggests a potential recovery if SHIB holds above the key $0.0000043 level.

Shiba Inu (SHIB) recovers slightly, trading at $0.0000044 on Wednesday, after finding support around the critical level earlier this week. The dog-themed meme coin shows improving sentiment as social dominance rises, funding rates turn positive, and bullish traders increase their long positions. On the technical side, SHIB suggests a potential recovery if it holds above the key $0.0000043 level.

On-chain and derivatives metrics show improving sentiment

Santiment’s Social Dominance metric for Shiba Inu supports a bullish outlook. The index measures the share of SHIB-related discussions across the cryptocurrency media. It has been recovering and trending higher since August 16, with a reading of 0.016% on Wednesday. This rise indicates improving market interest and sentiment among the meme coin investors.

SHIB Social Dominance chart. Source: Santiment

On the derivatives side, metrics also show improving conditions. CoinGlass’ long-to-short ratio for the dog-themed meme coin read 1.01 on Wednesday. The ratio being above one, indicates bullish sentiment, as traders are betting the asset’s price will rise.
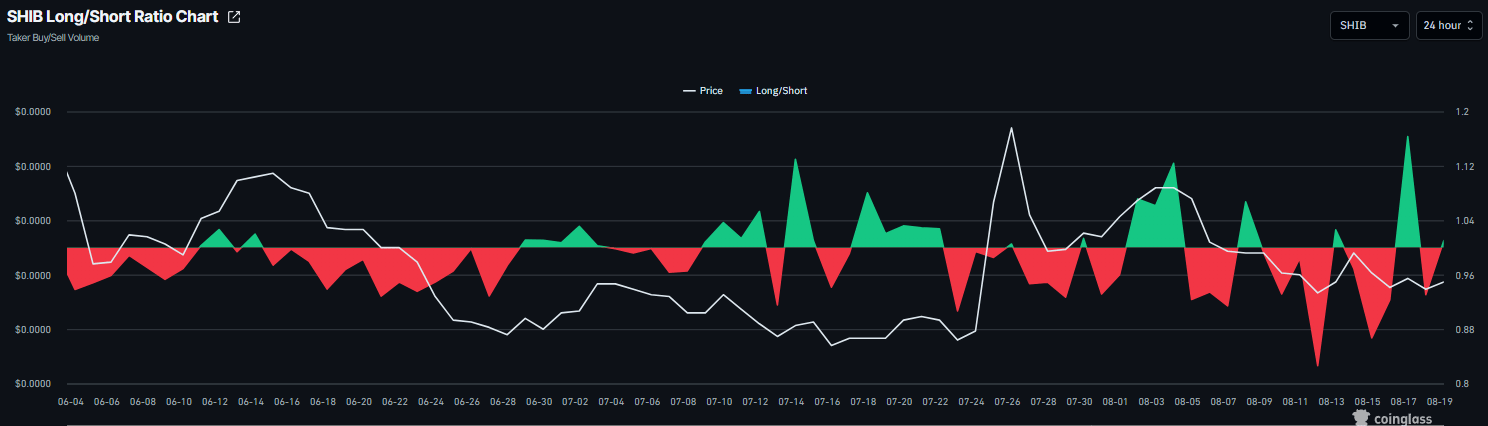
SHIB long-to-short ratio chart. Source: Coinglass

In addition, SHIB funding rates flipped positive on Tuesday, reading 0.0087% on Wednesday, indicating longs are paying shorts and signaling bullish sentiment.
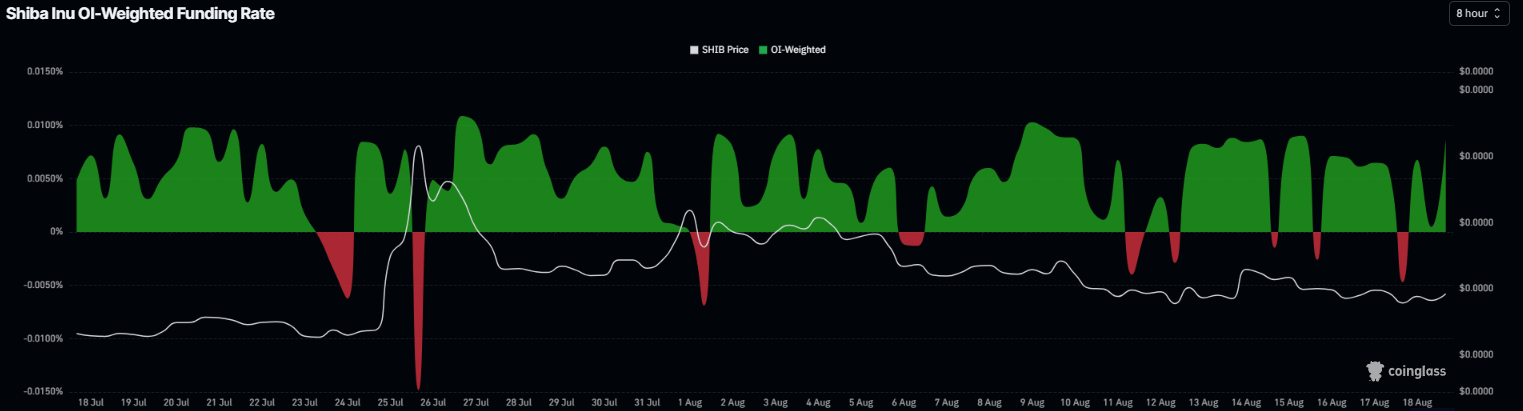
Shiba Inu funding rates chart. Source: Coinglass

Shiba Inu technical outlook: SHIB finds support around key zone

Shiba Inu price retested the daily support level at $0.0000043 on Tuesday and found support around it. As of writing on Wednesday, SHIB is rebounding, trading above $0.0000044.

If daily support at $0.0000043 holds, SHIB could extend the recovery toward the 50-day Exponential Moving Average (EMA) at $0.0000046.

The Relative Strength Index (RSI) is nearing the neutral 50 level, reading 46 on Wednesday and indicating that bearish momentum is weakening. The Moving Average Convergence Divergence (MACD) also shows fading red histogram bars, further suggesting that bearish momentum is losing strength.
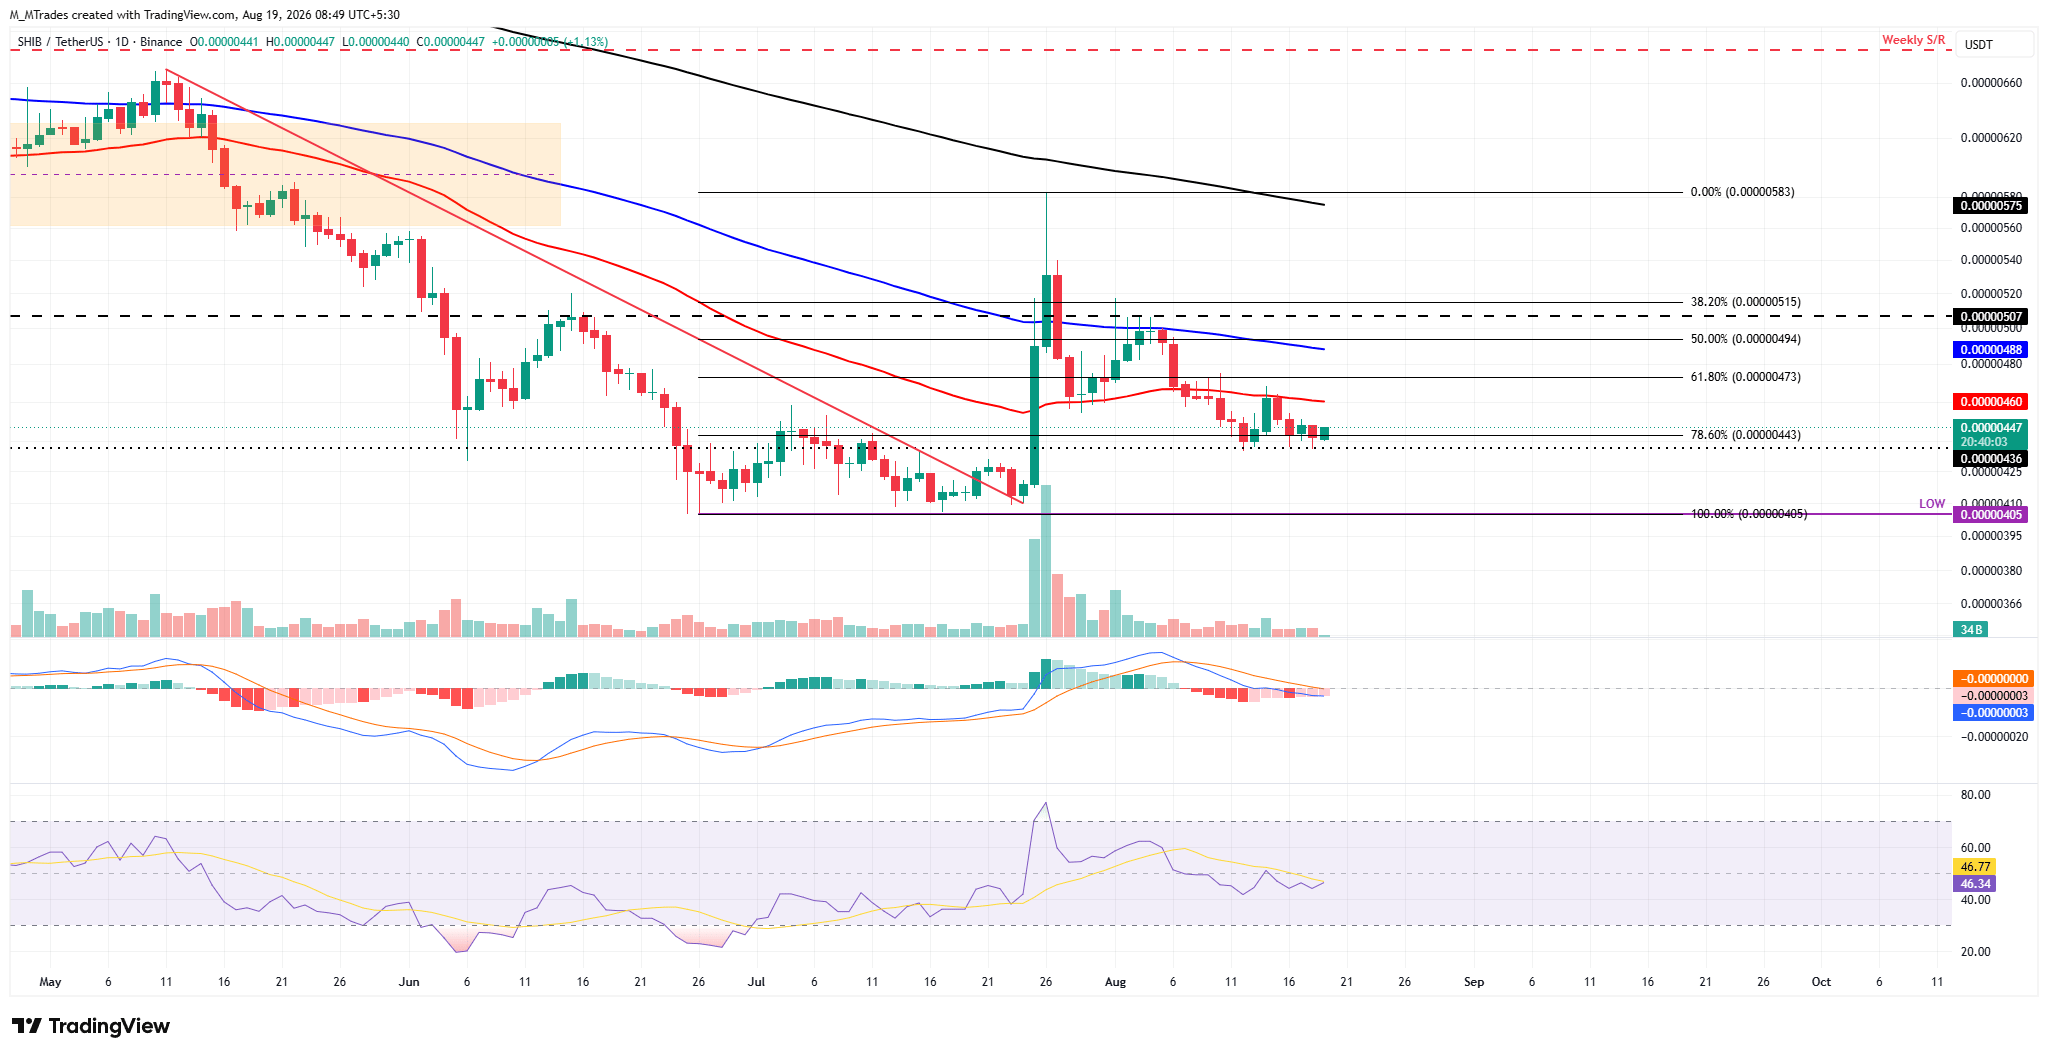
SHIB/USDT daily chart

However, if SHIB closes below the daily support at $0.0000043, it could extend the correction toward the next key psychological level of $0.0000040.

Disclaimer: For information purposes only. Past performance is not indicative of future results.
placeholder
XRP Price Prediction for July 2026: Can Buyers Finally Break the Downtrend?XRP (XRP) price trades near $1.05, caught between a year-long downtrend and a sudden burst of buying.July has historically rewarded XRP holders. This year the month arrives with on-chain accumulation
Author  Beincrypto
Jun 30, Tue
XRP (XRP) price trades near $1.05, caught between a year-long downtrend and a sudden burst of buying.July has historically rewarded XRP holders. This year the month arrives with on-chain accumulation
placeholder
XAUUSD Gold Analysis: Gold Holds Above $4,350 Ahead of US Inflation Data Is $4,500 Next? Gold holds above $4,350 following weak US jobs data. As inflation reports approach and UBS eyes $5,000, can XAUUSD break resistance at $4,435 to rally toward $4,500?
Author  Naoufal Seddik
Aug 12, Wed
Gold holds above $4,350 following weak US jobs data. As inflation reports approach and UBS eyes $5,000, can XAUUSD break resistance at $4,435 to rally toward $4,500?
placeholder
Gold Price Analysis Today: Gold Drops 1.32% Despite Lower Fed Rate-Hike Bets, Can $4,313 Support Hold? Gold fell 1.32% on August 13 after rising to $4,449.73, then reversing lower and closing near $4,349.918 below the $4,356.46 support. Softer US inflation data reduced Fed rate hike expectations, but selling pressure still dominated the session. Will $4,313 support hold?
Author  Naoufal Seddik
Aug 14, Fri
Gold fell 1.32% on August 13 after rising to $4,449.73, then reversing lower and closing near $4,349.918 below the $4,356.46 support. Softer US inflation data reduced Fed rate hike expectations, but selling pressure still dominated the session. Will $4,313 support hold?
placeholder
Gold Price Analysis Today: Gold Gains 0.94% as Markets Expect Fed to Hold Rates, Can $4,449 Resistance Break? Gold gained 0.94% on August 17, closing near $4,417.30 as softer US data strengthened expectations for unchanged Fed rates in September. Gold remains bullish, with $4,449.730 resistance and $4,310.650 support in focus.
Author  Naoufal Seddik
Yesterday 07: 02
Gold gained 0.94% on August 17, closing near $4,417.30 as softer US data strengthened expectations for unchanged Fed rates in September. Gold remains bullish, with $4,449.730 resistance and $4,310.650 support in focus.
placeholder
Gold Price Analysis Today: Gold Rebounds After 1.91% Drop as Yields Ease. Is $4,449 Next? Gold fell about 1.91% on August 18 before producing a strong bullish reaction from the 1-hour demand zone in early August 19 trading. RSI is recovering from oversold conditions, but Supertrend remains bearish as traders await the Fed minutes.
Author  Naoufal Seddik
2 hours ago
Gold fell about 1.91% on August 18 before producing a strong bullish reaction from the 1-hour demand zone in early August 19 trading. RSI is recovering from oversold conditions, but Supertrend remains bearish as traders await the Fed minutes.
goTop
quote