


Monero Price Forecast: Extends rally as derivatives metrics, technical signals turn firmly bullish
- Monero extends its gains on Thursday after finding support around a key zone and surging over 3% the previous day.
- Derivatives data supports bullish sentiment, with rising open interest and increasing long bets.
- The technical outlook points to further rally, with indicators showing signs of strengthening bullish momentum.
Monero (XMR) extends its gains, trading above $397 on Thursday after finding support around the key support zone the previous day. Strengthening derivatives metrics and a constructive technical outlook suggest momentum is building, hinting at a further rally for XMR.
Derivatives data backs bullish sentiment
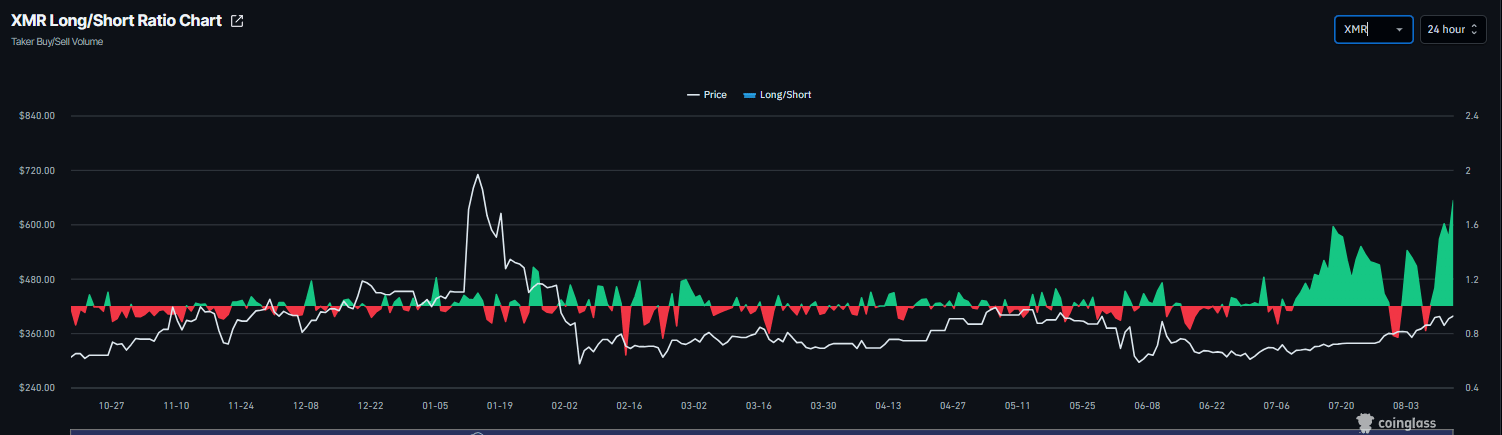
Derivatives data shows bullish sentiment among Monero traders. CoinGlass’ long-to-short ratio for XMR reads 1.77 on Thursday, the highest level over a month. A ratio above one indicates bullish sentiment, as traders are betting the asset price will rise.
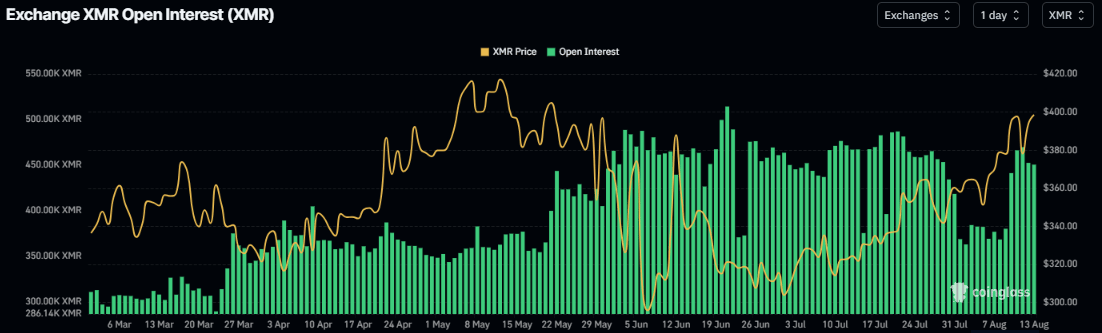
CoinGlass’ Open Interest (OI) for Monero across exchanges has been surging since early August, with outstanding contracts reaching 450.35K XMR coins on Thursday. The increase in OI alongside rising prices suggests that new long positions are entering the market, signaling a potential upside.
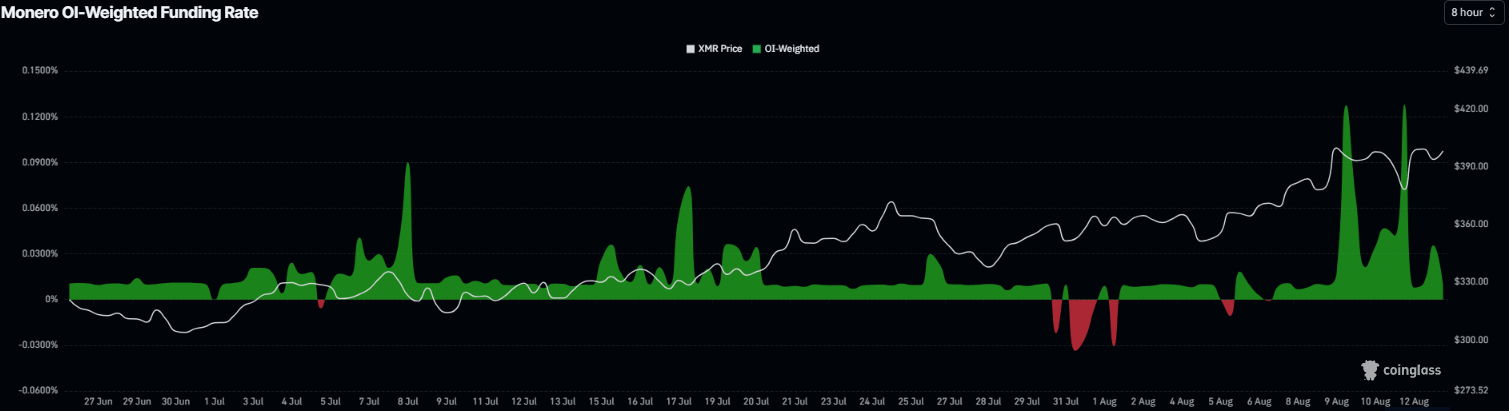
In addition, CoinGlass’ funding rates metric for XMR flipped positive on August 7, steadily rising to 0.010% on Thursday. This positive rate indicates that long traders are paying shorts and reflects a bullish bias.
XMR technical outlook: Key support holds strong
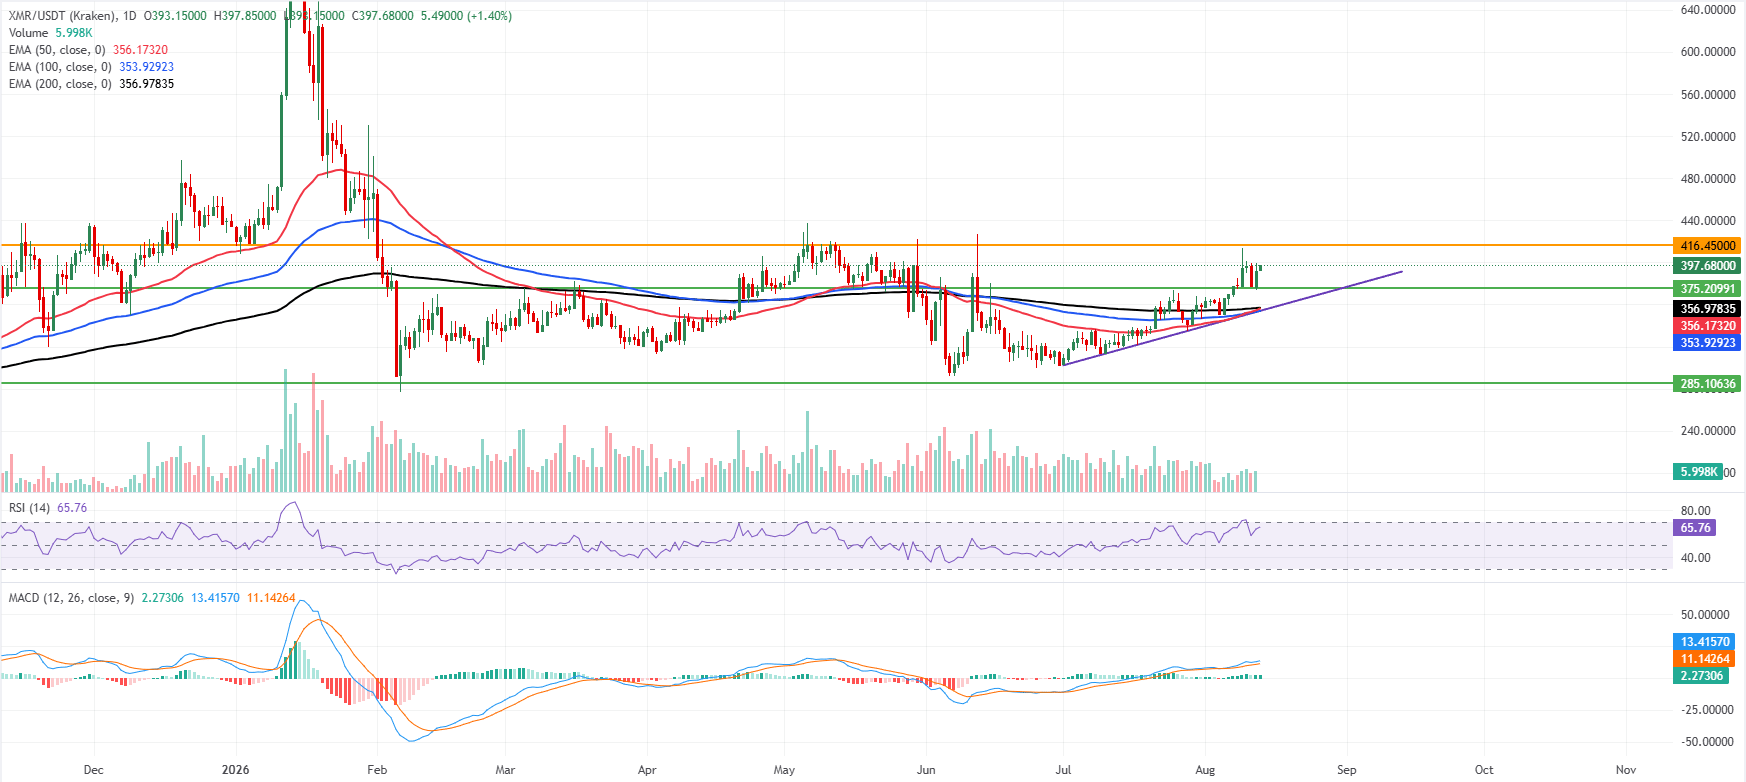
Monero price trades at $397.68, extending its advance above the key Exponential Moving Averages (EMAs), with the 50-day EMA at $356.17, the 100-day EMA at $353.92 and the 200-day EMA at $356.97 all providing underlying demand.
XMR price also sits comfortably over the rising trendline support near $354.18 and the intermediate horizontal floor around $375.20, keeping the near-term bias bullish. Momentum remains constructive, as the Relative Strength Index (RSI) holds in the mid-60s, while Moving Average Convergence Divergence (MACD) stays in positive territory with the line above zero and the recent histogram expansion hinting at sustained upside pressure, even as conditions approach overbought territory.
On the downside, initial support is seen at the horizontal level near $375.20 ahead of a dense structural cluster formed by the 50-day, 100-day and 200-day EMAs between roughly $353.92 and $356.97, reinforced by the rising trendline break price at $354.18; a daily close below this band would signal waning bullish control and open room toward the deeper horizontal base at $285.11.
On the topside, the next notable hurdle is the horizontal resistance at $416.45, and a decisive break above this barrier would likely extend the uptrend and invite a fresh leg higher as long as price continues to hold above the EMA cluster and trend support.
(The technical analysis of this story was written with the help of an AI tool. Know more.)
Recommended Articles


