


NZD/USD (NZDUSD) Drops 0.56% on Aug 13: What Does the Market Value?
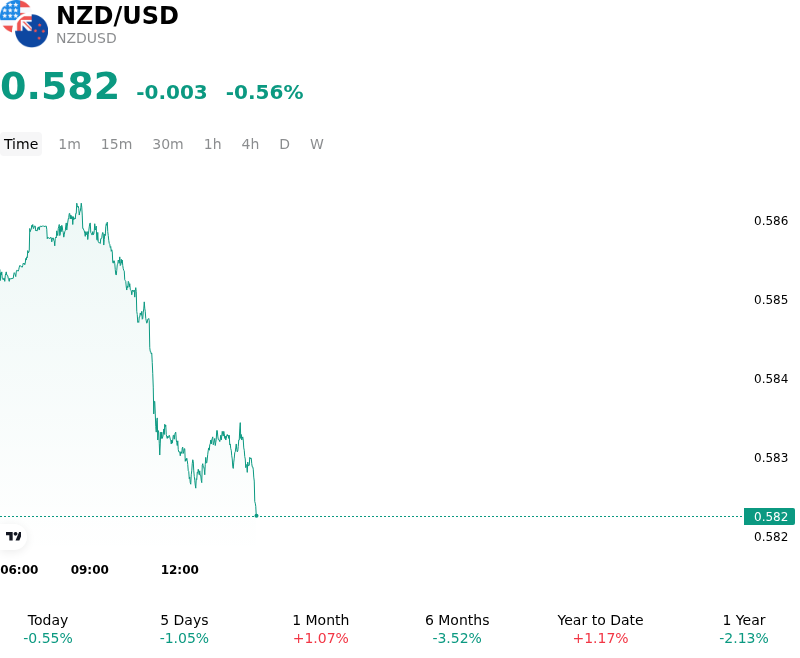
NZD/USD (NZDUSD) is down 0.56% at Aug 13 02:35(ET), now at $0.58218, with a 7-day down of 0.77%.
What is driving NZD/USD (NZDUSD)’s stock price down today?
The decline in the New Zealand dollar against the U.S. dollar was primarily driven by a dovish repricing of Reserve Bank of New Zealand policy expectations following the release of the central bank's quarterly survey of expectations. The survey revealed that two-year inflation expectations—a critical metric closely monitored by the RBNZ when evaluating monetary policy—cooled to 2.34% in the third quarter. One-year forward inflation projections also moderated significantly. Because two-year inflation expectations serve as a key anchor for domestic price-setting behavior and central bank strategy, the softer reading reduced market expectations for aggressive rate hikes from the RBNZ, eroding domestic yield support and prompting institutional investors to pare back long kiwi positions.
On the quote currency side, the U.S. dollar maintained a firm stance across major currency pairs, supported by resilient U.S. economic indicators and ongoing hawkish debate within the Federal Reserve. Investors digested wholesale inflation data from the U.S. Producer Price Index while monitoring elevated U.S. Treasury yields. Additionally, persistent geopolitical uncertainties in the Middle East helped maintain underlying safe-haven demand for the U.S. dollar, further burdening risk-sensitive and commodity-aligned currencies like the New Zealand dollar.
The combination of lower New Zealand interest rate expectations and stable U.S. yields widened short-term rate differentials in favor of the greenback. This interest rate dynamic, alongside a shift toward risk aversion, triggered technical selling once key support levels were breached. While markets continue to evaluate the potential for further policy adjustments by the RBNZ later in the cycle, the immediate reduction in domestic inflation expectations removed a key driver of New Zealand dollar outperformance, leaving the pair exposed to broader macro trends dictated by Federal Reserve policy expectations.
Technical Analysis of NZD/USD (NZDUSD)
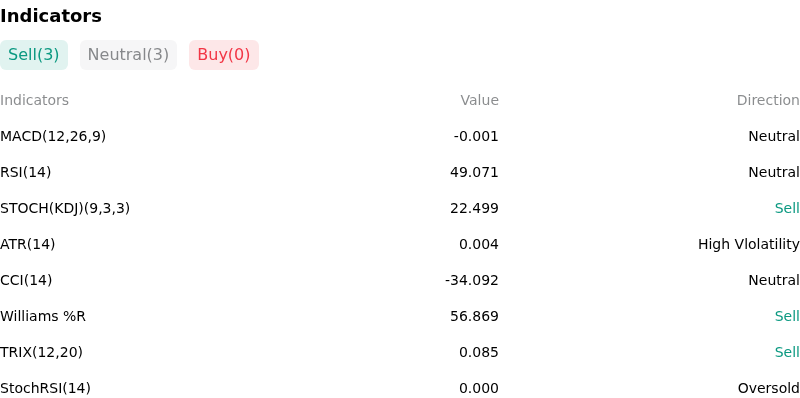
Technically, NZD/USD (NZDUSD) shows a MACD (12,26,9) value of -0.001, indicating a neutral signal. The RSI at 49.071 suggests neutral condition and the Williams %R at 56.869 suggests sell condition. Please monitor closely.
More details about NZD/USD (NZDUSD)
Recent Events and Risks:
- Geopolitical Friction and Safe-Haven Dollar Demand: Stalled diplomatic negotiations regarding Middle East conflicts and lingering maritime trade disruptions have dampened global risk appetite. This risk-off environment has redirected capital flows into the US Dollar, exerting significant intraday downward pressure on high-beta, pro-cyclical currencies like the New Zealand Dollar.
- Chinese Economic Slowdown and Export Demand Drag: Subdued economic activity and contracting manufacturing PMI metrics in China—New Zealand's largest trading partner—have reduced demand expectations for agricultural and soft commodity exports. This structural weakness in regional demand continues to sap fundamental support for the Kiwi.
- Domestic Growth Softening and RBNZ Over-Tightening Concerns: Indications of a loosening domestic labor market and rising unemployment have fueled concerns among institutional desks that the Reserve Bank of New Zealand's restrictive policy stance could trigger a broader economic contraction, prompting traders to hedge against an eventual dovish pivot.
- Yield Spread Compression and Persistent Fed Hawkishness: Resilient US economic indicators and elevated US Treasury yields have sustained firm demand for the Greenback. Market expectations that the Federal Reserve will maintain restrictive interest rates for longer continue to weigh on NZD/USD through unfavorable rate differential dynamics.
Recommended Articles


