


Worldcoin Price Forecast: WLD steadies as multiple bullish signals line up
- Worldcoin holds steady near $0.3838 on Thursday, capped by the 50-day EMA at $0.4141.
- The WLD token unlock rate is set to decrease by 43% on Friday under unlock schedules, reducing token emissions and easing supply pressure.
- Retail demand holds firm with a 40% increase in trading volume and a positive funding rate.
Woldcoin (WLD) price trades around $0.3838 at press time on Thursday, extending a consolidative tone capped beneath the 50-day Exponential Moving Average (EMA) at $0.4141. WLD token emissions are scheduled to drop by 43% from Friday, reducing supply pressure. Retail activity in WLD derivatives remains firm, with a 40% rise in trading volume and elevated funding rates.
Headwinds to ease for Worldcoin
Worldcoin prepares to reduce daily token emissions by 43% on Friday. Community locked tokens emission rate will drop by 50%, from 3.2 million WLD to 1.6 million WLD, while team and investor emissions will decline by 32% from 1.9 million WLD to 1.3 million WLD. Taken together, the total emissions will approximately reduce from 5.1 million WLD to 2.9 million WLD. Typically, a reduction in the new token supply entering the market potentially eases supply pressure.
In addition, Grayscale submitted an S-1 application for a WLD-focused Exchange Traded Fund (ETF), which could boost institutional demand if approved.
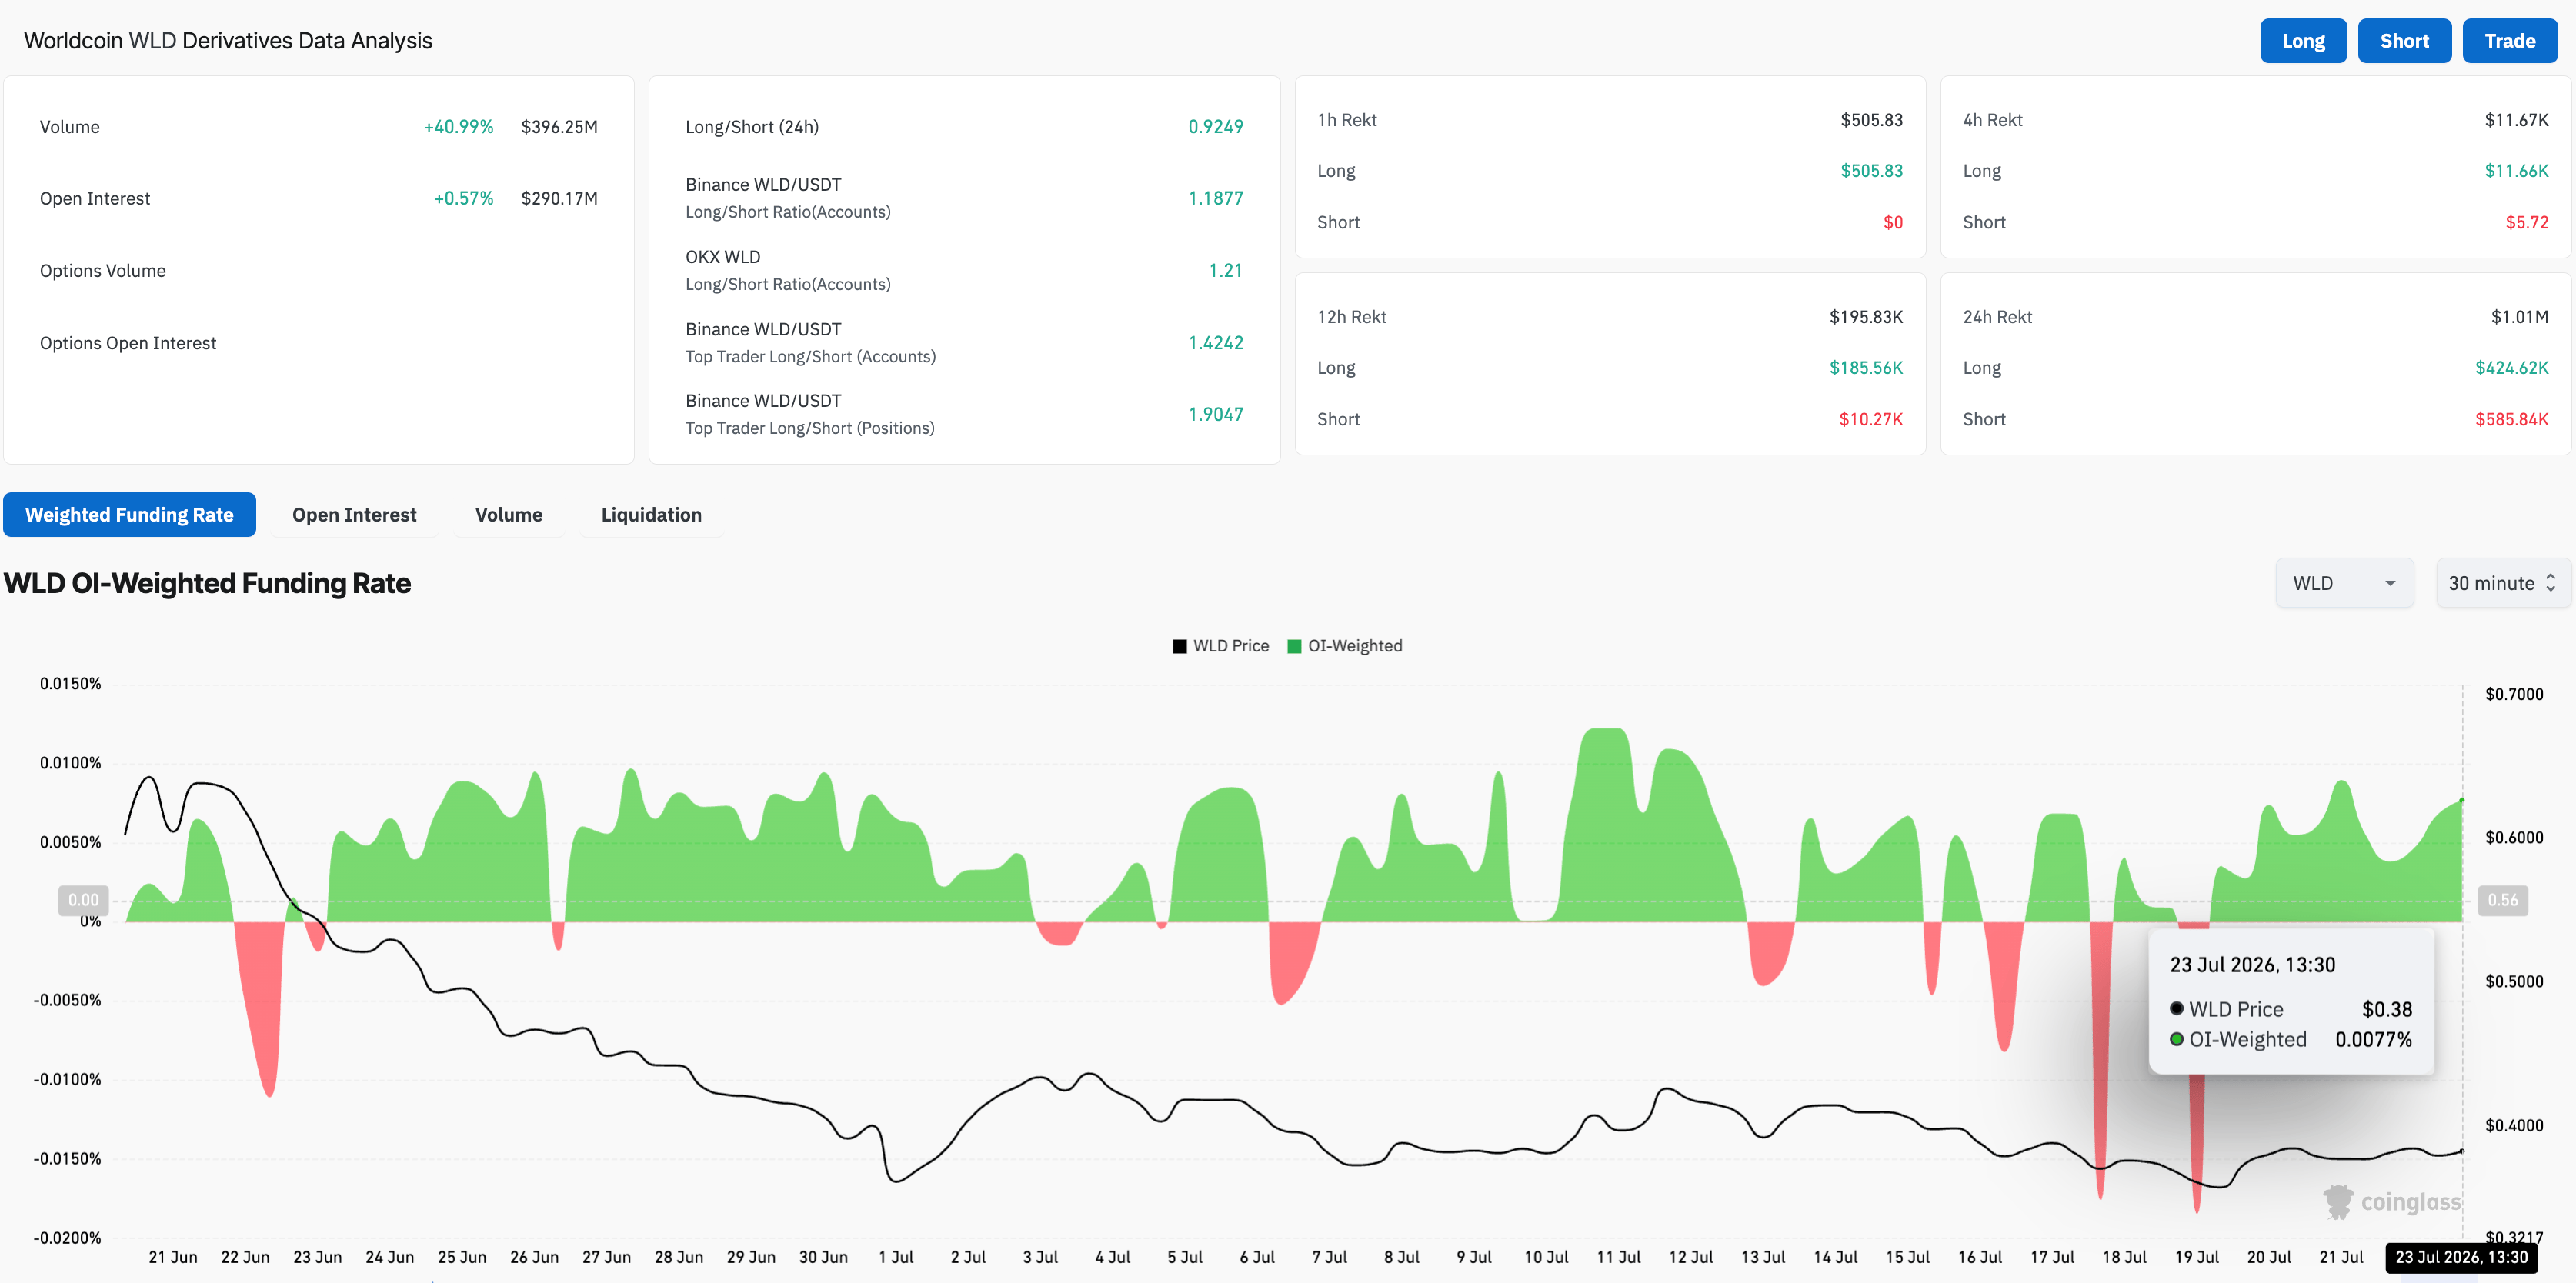
On the retail front, speculative activity in WLD derivatives remains elevated. CoinGlass data shows the trading volume is up 40% in the last 24 hours to $396.25 million, while the notional value of active perpetual contracts remains stable, with Open Interest (OI) holding at $290.17 million. At the same time, the funding rate remains positive at 0.0077%, reflecting a bullish bias among traders.
Jake Kennis, Senior Research Analyst at Nansen, told FXStreet, “43% unlock reduction cuts daily emissions by nearly 2.2 million WLD tokens, while the Grayscale spot ETF application opens a regulated demand channel.” Kensin added, “If the ETF is approved and attracts inflows, shrinking new supply, meeting a fresh buyer base, which could lead to a genuine supply-demand tightening if the demand is high enough.”
Beyond the ETF and supply cut decision, Kennis highlighted, “World Chain scaling and full network decentralization, which is targeted for late 2026, ecosystem expansion, Orb rollout, and real world integrations with merchant payment partnerships,” could boost demand for WLD tokens. However, regulatory developments around biometric ID, which remain the project's biggest existential risk.
Could Worldcoin regain bullish momentum?
Worldcoin holds below both the 50-day and 200-day EMAs, which keeps the near-term bias bearish. From a technical perspective, WLD consolidates between 50-day EMA at $0.4141 and the 23.6% Fibonacci retracement of the upswing from $0.2267 to $0.27229, at $0.3438.
The Moving Average Convergence Divergence (MACD) sits marginally above its signal line, indicating consolidative momentum. At the same time, the Relative Strength Index (RSI) around 44 shows a bullish divergence with the higher low formation during the July 1 and 19 lows.
A decisive close above $0.4141 could test the resistance cluster of the 200-day EMA at $0.4654 and the 50% retracement at $0.4748. If WLD clears this zone, the 78.6% Fibonacci retracement at $0.6167 could emerge as the next overhead target.
Looking down, the crucial support for WLD emerges at $0.3438, where a sustained close could extend its decline to the Fibonacci anchor at $0.2267.
(The technical analysis of this story was written with the help of an AI tool. Know more.)
Recommended Articles


