


Cardano Price Forecast: Whale accumulation, van Rossem hard fork update support recovery prospects
- Cardano trades slightly lower on Thursday after a mild rejection the previous day.
- Whale wallets holding between 100,000 and 100 million ADA have increased their holdings to 25.65 billion ADA, the highest level since February 2023.
- Improving derivatives metrics and the upcoming van Rossem hard fork could provide additional support for ADA’s recovery.
Cardano (ADA) trades slightly lower around $0.161 on Thursday after a mild rejection the previous day. Despite the price pullback, on-chain data show that wallets holding ADA tokens are accumulating, signaling growing confidence among large investors. In addition, improvements to derivatives metrics and the upcoming van Rossem hard fork update could provide a catalyst for ADA’s potential recovery.
Whales buy while retail sells
Santiment chart below shows that Cardano’s 100,000 to 100 million ADA wallets now hold more than 25.65 billion coins, their highest level since February 2023. Meanwhile, the sub-100 ADA wallets own roughly 0.7% fewer coins than they did four months ago. This divergence among holders suggests that larger investors have been accumulating ADA. In contrast, smaller holders have reduced their exposure, indicating growing confidence among whales and could support a potential recovery ahead.
 [11-1784191906274.05.29, 16 Jul, 2026].png)
In addition, Intersect, a member-based organization for the Cardano ecosystem, announced on Wednesday that following ratification on Monday, the van Rossem hard fork update will be enacted this Saturday. The upgrade introduces new Plutus functionality and protocol improvements to enhance Cardano’s smart contract capabilities and network efficiency, which could serve as a positive catalyst for ADA.
Derivatives metrics support improving sentiment
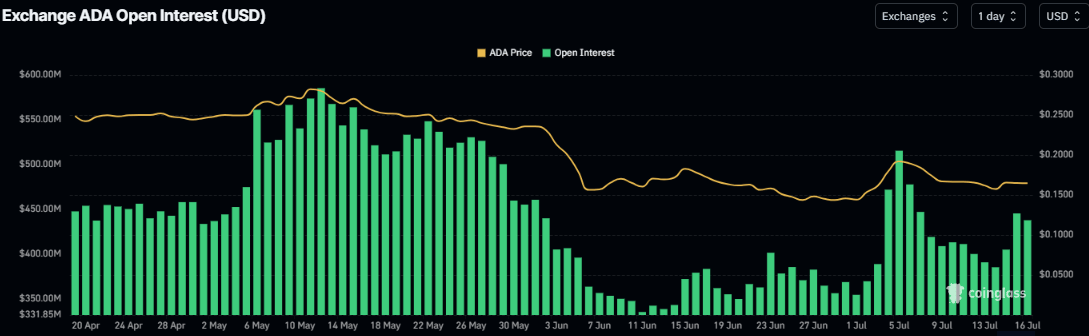
Derivatives metrics show mild signs of improvement for Cardano. ADA’s futures Open Interest (OI) has risen to $445 million on Thursday, up from $385 million on Monday. This rise in OI, alongside the recent price recovery, suggests fresh capital is entering the market, indicating improving trader confidence and supporting the case for a further rebound.
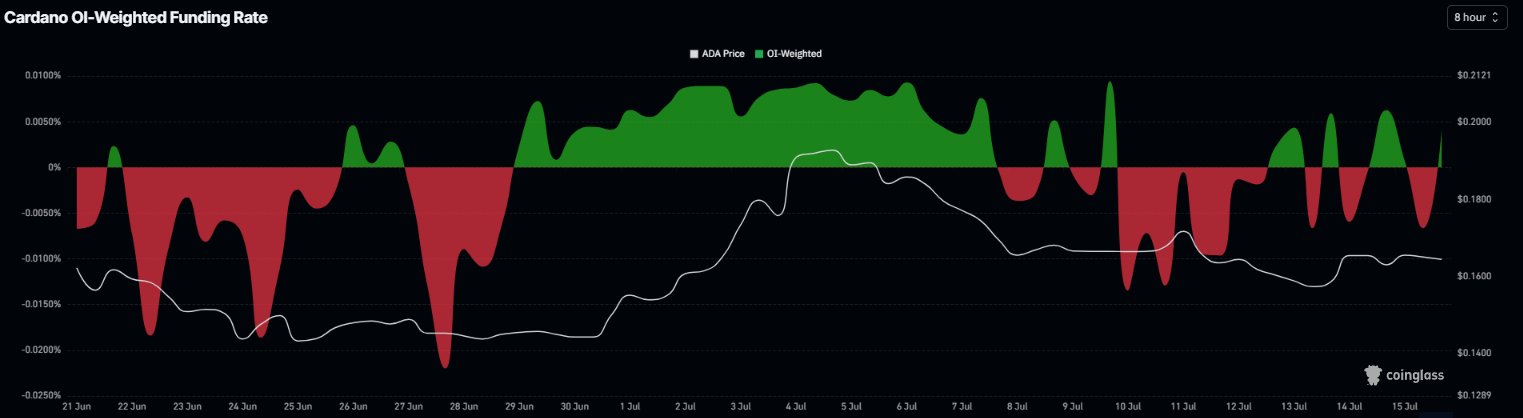
In addition, Cardano’s Funding rates flipped positive, reading 0.0042% on Thursday, indicating longs are paying the shorts and highlighting improving sentiment.
Cardano Price Forecast: Faces rejection around key resistance
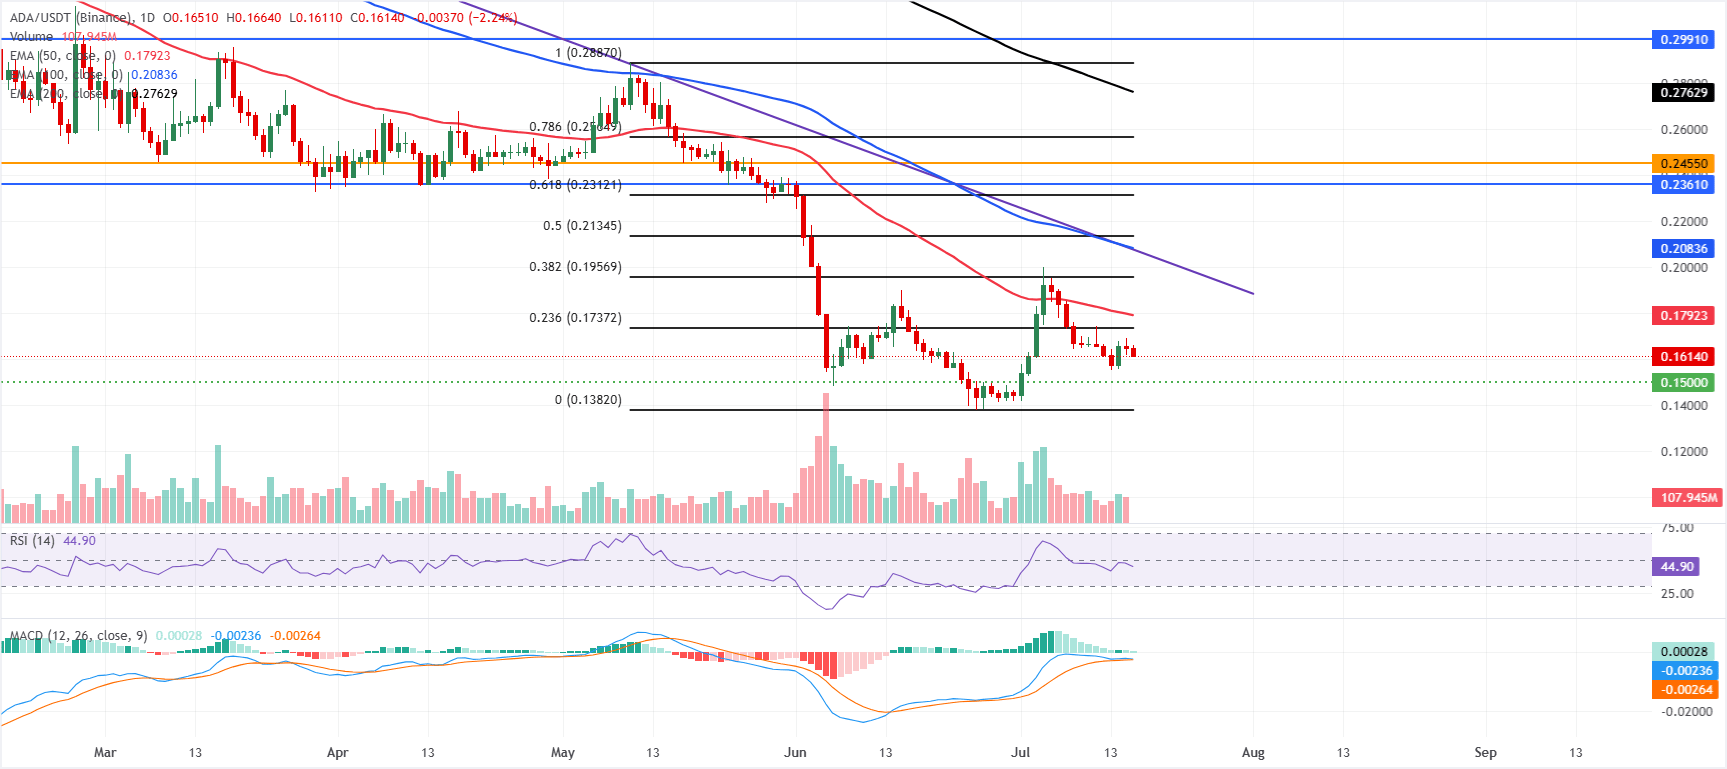
Cardano price trades slightly down on Thursday, trading at $0.161. ADA maintains a bearish bias as price remains well below the 50-day, 100-day, and 200-day Exponential Moving Averages (EMAs) at $0.179, $0.208, and $0.276, respectively.
The pair also trades below the 23.6% Fibonacci retracement at $0.173 and the downtrend-break threshold near $0.207, suggesting rallies remain capped within a broader corrective structure.
The Relative Strength Index (RSI) on the daily chart is 44, in neutral territory. At the same time, the Moving Average Convergence Divergence (MACD) indicator shows a small positive reading, hinting at only modest bullish momentum that so far fails to challenge the prevailing overhead resistance.
On the topside, initial resistance is seen at the 23.6% Fibonacci retracement at $0.173, followed by the 50-day EMA at $0.179 and a denser cluster between the 38.2% Fibonacci retracement at $0.195 and the trend-line break at $0.207, reinforced by the 100-day EMA at $0.208. Higher up, the 50% retracement at $0.2135.
On the downside, immediate support lies at the horizontal floor around $0.1500, ahead of the June 25 low at $0.1382, where sellers could hesitate, and short-term dip-buying interest may reappear.
(The technical analysis of this story was written with the help of an AI tool. Know more.)
Recommended Articles


