

Cardano Price Forecast: Fading bearish momentum offers hope for recovery

Source Fxstreet
  • Cardano steadies at $0.145 on Monday after losing more than 21% over the last two weeks.
  • Derivatives metrics continue to cap ADA's recovery, with negative funding rates and increasing short positioning among traders.
  • Despite the weak derivatives backdrop, technical indicators suggest bearish momentum is fading, pointing to early signs of a potential recovery.

Cardano (ADA) is stabilizing around $0.145 at the time of writing on Monday after suffering a sharp 21% decline over the previous two weeks. Derivatives metrics continue to reflect cautious market sentiment; however, fading bearish momentum suggests ADA could recover in the coming days.

Derivatives data shows cautious market sentiment

On the derivatives side, Cardano data continues to show bearish bias. CoinGlass’ long-to-short ratio for ADA reads 0.72 on Monday, the lowest level in over a month. This ratio, being below 1, reflects bearish sentiment in the market, as more traders are betting the asset’s price will fall.
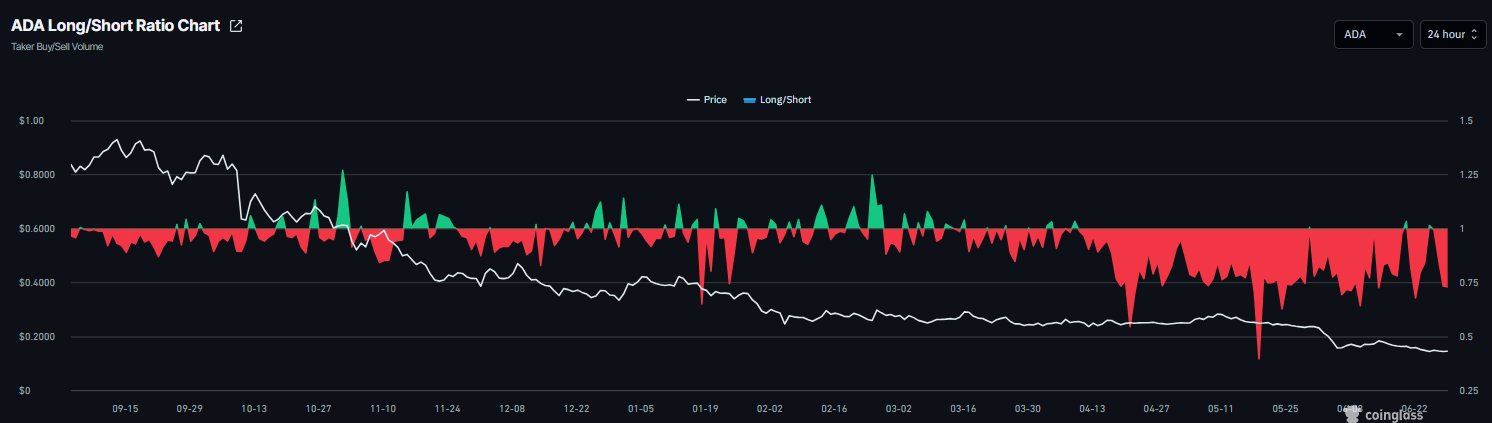
ADA long-to-short ratio chart. Source: Coinglass

In addition, the funding rates flipped negative on Saturday and read -0.0055% on Monday, indicating that shorts are paying longs and projecting a bearish outlook.
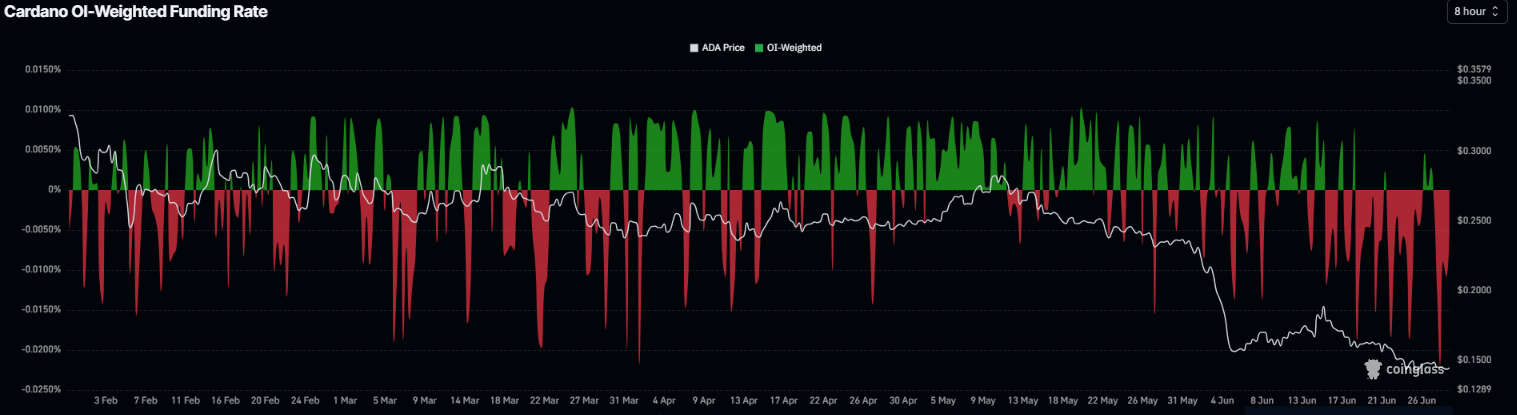
Cardano funding rates chart. Source: Coinglass

Some signs of optimism

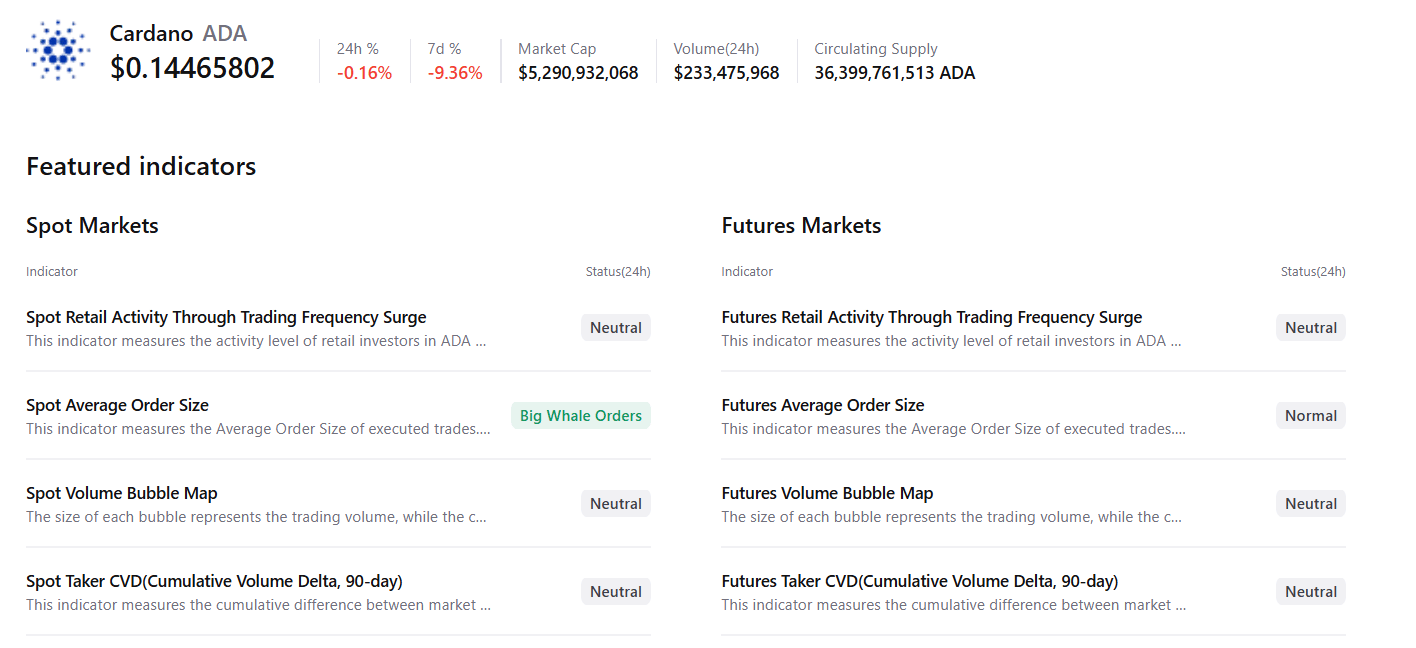
CryptoQuant’s summary data shows mild bullish sentiment. Cardano’s spot markets show large whale orders amid neutral conditions across other metrics, supporting a potential recovery.
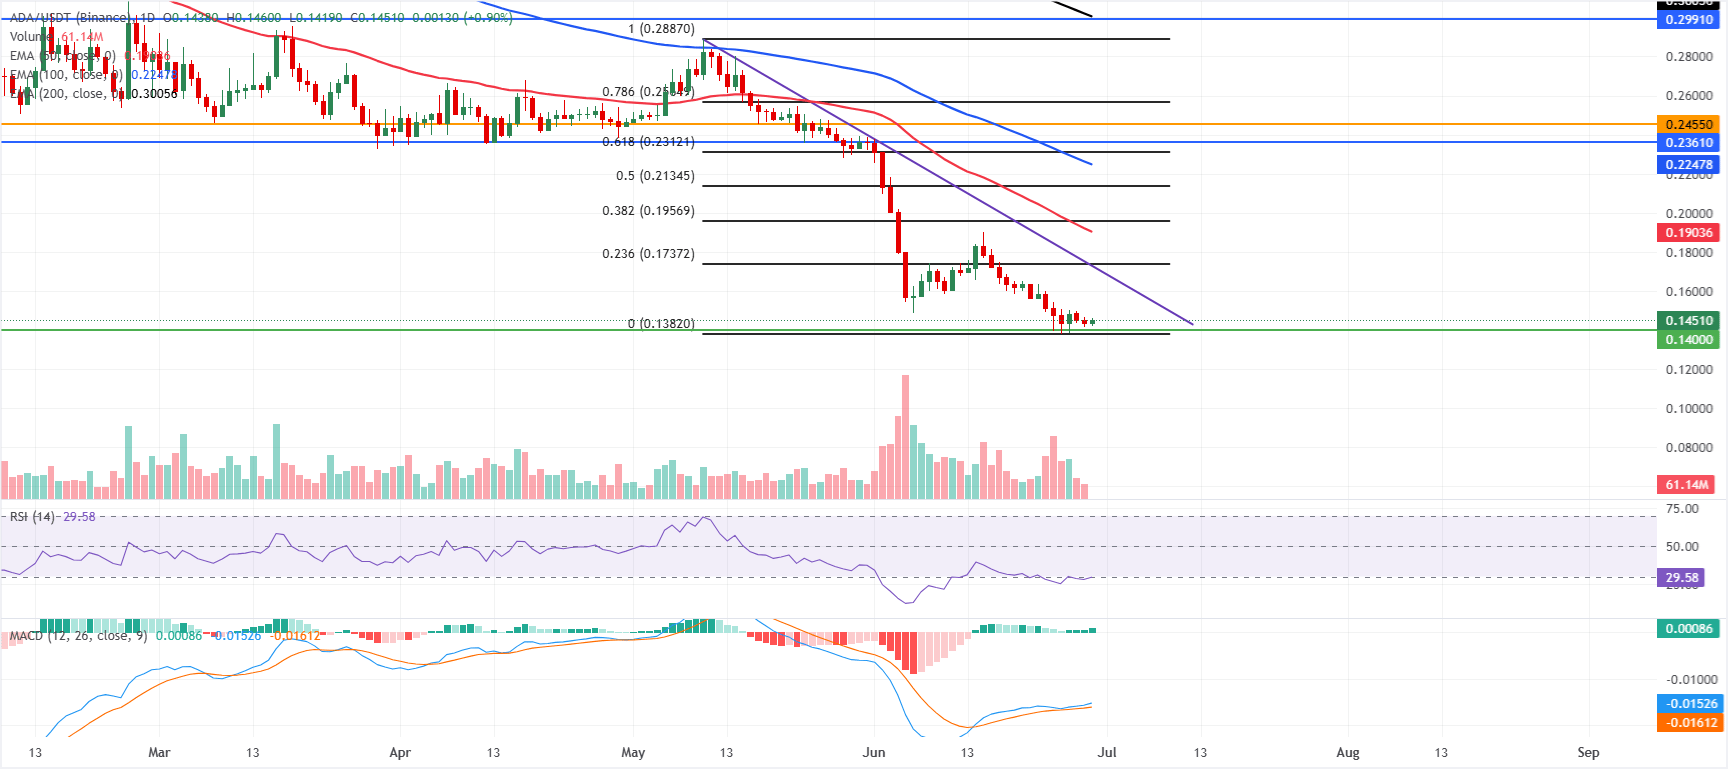
Cardano Price Forecast: ADA could rebound if $0.140 holds strong

Cardano price trades at $0.145 on Monday, finding support around the key $0.140 psychological support over the weekend. ADA has corrected by over 21% in the last two weeks and continues to maintain its bearish bias, holding well below the 50-day, 100-day, and 200-day Exponential Moving Averages (EMAs) at $0.1904, $0.2248, and $0.3006, respectively. 

The Relative Strength Index (RSI) at 29 flirts with oversold territory. The Moving Average Convergence Divergence (MACD) indicator has turned marginally positive. However, with prices still suppressed across all major EMAs, this suggests only tentative stabilization rather than a clear recovery.

On the downside, a daily close back under $0.1451 would expose the horizontal support at $0.1400 ahead of the structural low around $0.1382. 

On the topside, initial resistance is clustered in the $0.1726–$0.1737 area where the broken descending trendline and the 23.6% Fibonacci retracement converge, followed by the 50-day EMA near $0.1904 and the 38.2% retracement at $0.1957. Higher up, the mid-range barrier at $0.2134 and the 100-day EMA at $0.2248 precede a dense supply band between $0.2312 and $0.2565, while more substantial resistance waits at the horizontal levels of $0.2991 and the 200-day EMA around $0.3006.
(The technical analysis of this story was written with the help of an AI tool.)

Disclaimer: For information purposes only. Past performance is not indicative of future results.
placeholder
OPEC+ Deepens Production Hikes as Hormuz Bottlenecks Stifle Actual SupplyOPEC+ core members will lift July oil quotas by 188,000 barrels per day, but geopolitical shipping constraints and the UAE’s exit keep actual global crude supplies tight.
Author  Mitrade Team
Jun 08, Mon
OPEC+ core members will lift July oil quotas by 188,000 barrels per day, but geopolitical shipping constraints and the UAE’s exit keep actual global crude supplies tight.
placeholder
XRP Price Prediction for July 2026: Can Buyers Finally Break the Downtrend?XRP (XRP) price trades near $1.05, caught between a year-long downtrend and a sudden burst of buying.July has historically rewarded XRP holders. This year the month arrives with on-chain accumulation
Author  Beincrypto
Jun 30, Tue
XRP (XRP) price trades near $1.05, caught between a year-long downtrend and a sudden burst of buying.July has historically rewarded XRP holders. This year the month arrives with on-chain accumulation
placeholder
XAUUSD Gold Analysis: Gold Holds Above $4,350 Ahead of US Inflation Data Is $4,500 Next? Gold holds above $4,350 following weak US jobs data. As inflation reports approach and UBS eyes $5,000, can XAUUSD break resistance at $4,435 to rally toward $4,500?
Author  Naoufal Seddik
Aug 12, Wed
Gold holds above $4,350 following weak US jobs data. As inflation reports approach and UBS eyes $5,000, can XAUUSD break resistance at $4,435 to rally toward $4,500?
placeholder
Gold Price Analysis Today: Gold Drops 1.32% Despite Lower Fed Rate-Hike Bets, Can $4,313 Support Hold? Gold fell 1.32% on August 13 after rising to $4,449.73, then reversing lower and closing near $4,349.918 below the $4,356.46 support. Softer US inflation data reduced Fed rate hike expectations, but selling pressure still dominated the session. Will $4,313 support hold?
Author  Naoufal Seddik
Aug 14, Fri
Gold fell 1.32% on August 13 after rising to $4,449.73, then reversing lower and closing near $4,349.918 below the $4,356.46 support. Softer US inflation data reduced Fed rate hike expectations, but selling pressure still dominated the session. Will $4,313 support hold?
placeholder
Gold Price Analysis Today: Gold Gains 0.94% as Markets Expect Fed to Hold Rates, Can $4,449 Resistance Break? Gold gained 0.94% on August 17, closing near $4,417.30 as softer US data strengthened expectations for unchanged Fed rates in September. Gold remains bullish, with $4,449.730 resistance and $4,310.650 support in focus.
Author  Naoufal Seddik
Aug 18, Tue
Gold gained 0.94% on August 17, closing near $4,417.30 as softer US data strengthened expectations for unchanged Fed rates in September. Gold remains bullish, with $4,449.730 resistance and $4,310.650 support in focus.
Related Instrument
goTop
quote