


WTI recovers strongly above $90 even as Middle East oil flows reach pre-war levels
- Oil prices recover strongly to near $91.00 despite energy flows through the Middle East reach its pre-war levels.
- Kpler shows seven-day average of energy flows remain 19.5 million bpd as of Monday.
- Iran might be losing its control on the Hormuz strait to the US.
West Texas Intermediate (WTI), futures on NYMEX, claws back its slight early losses after attracting significant bids slightly below $88.00. The oil price has recovered vertically and has reclaimed the $90.00, trading 1.7% higher near $91.00 in the European trade.
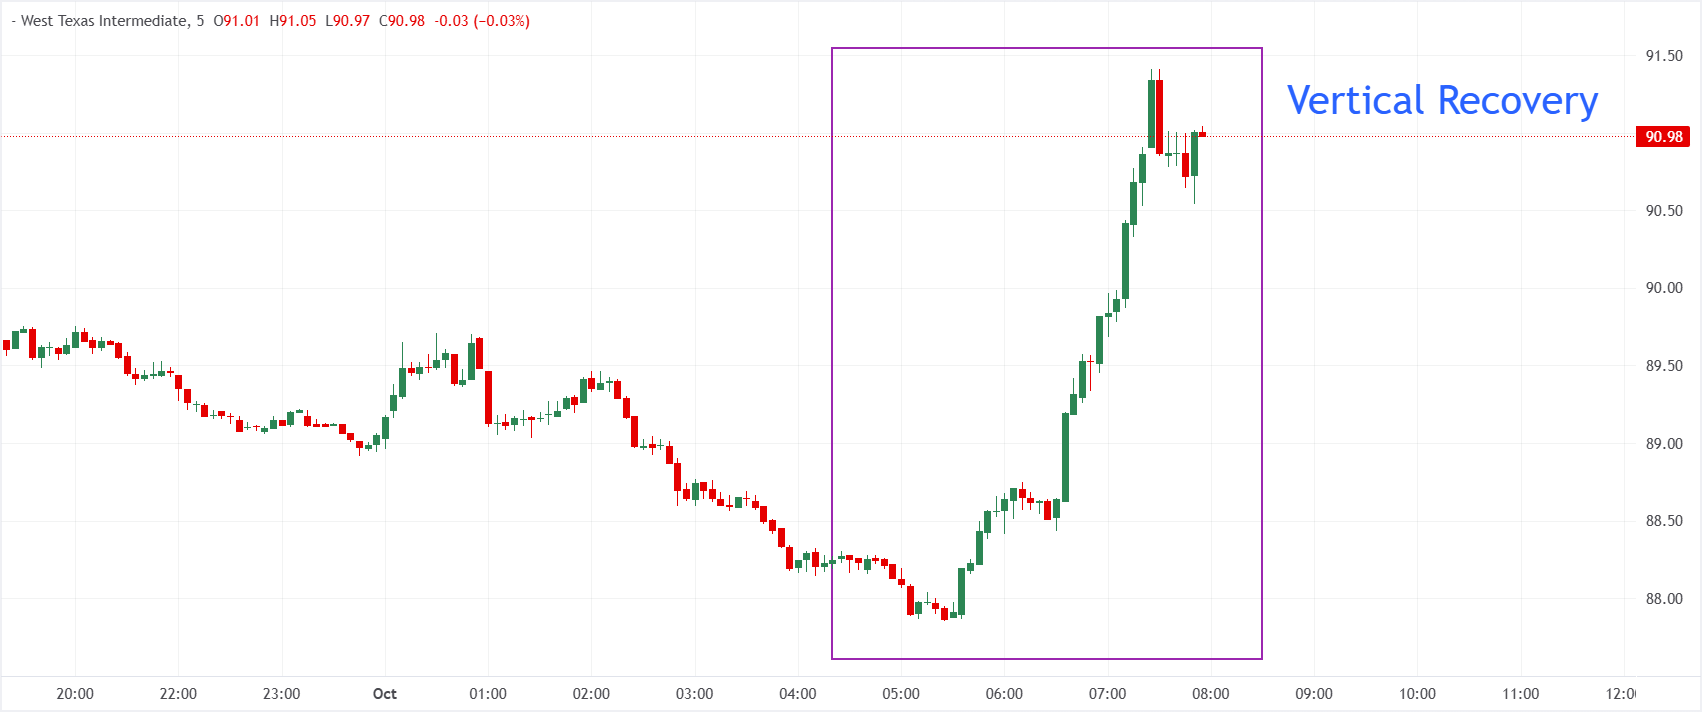
The oil price bounced back strongly even as energy flows through the Middle East region have returned to pre-war level, with United States (US) military escorts supporting a safe passage to shipments through the Strait of Hormuz, a critical chokepoint to almost 20% of global energy supply,. Also, the restoration of half of flows through Saudi’s East-West pipeline has improved the overall supply.
According to data from Kpler, crude oil shipments from the Middle East region, including the Persian Gulf and Red Sea, are sometimes higher than prewar levels. The region reached a seven-day average of 19.5 million barrels per day (bpd) as of Monday, surpassing a prewar baseline of about 17 million bpd, CNBC reported.
Kpler has also signaled signs that Iran is losing its dominance over the Hormuz, which is resulting in a significant supply of energy through the passage.
Matt Smith, director of commodity research at Kpler, said that Iran has claimed throughout the war that it controls Hormuz and has declared the closure of the strait multiple times. But Tehran is losing its influence as strong volumes pass through Hormuz.
WTI Technical Analysis
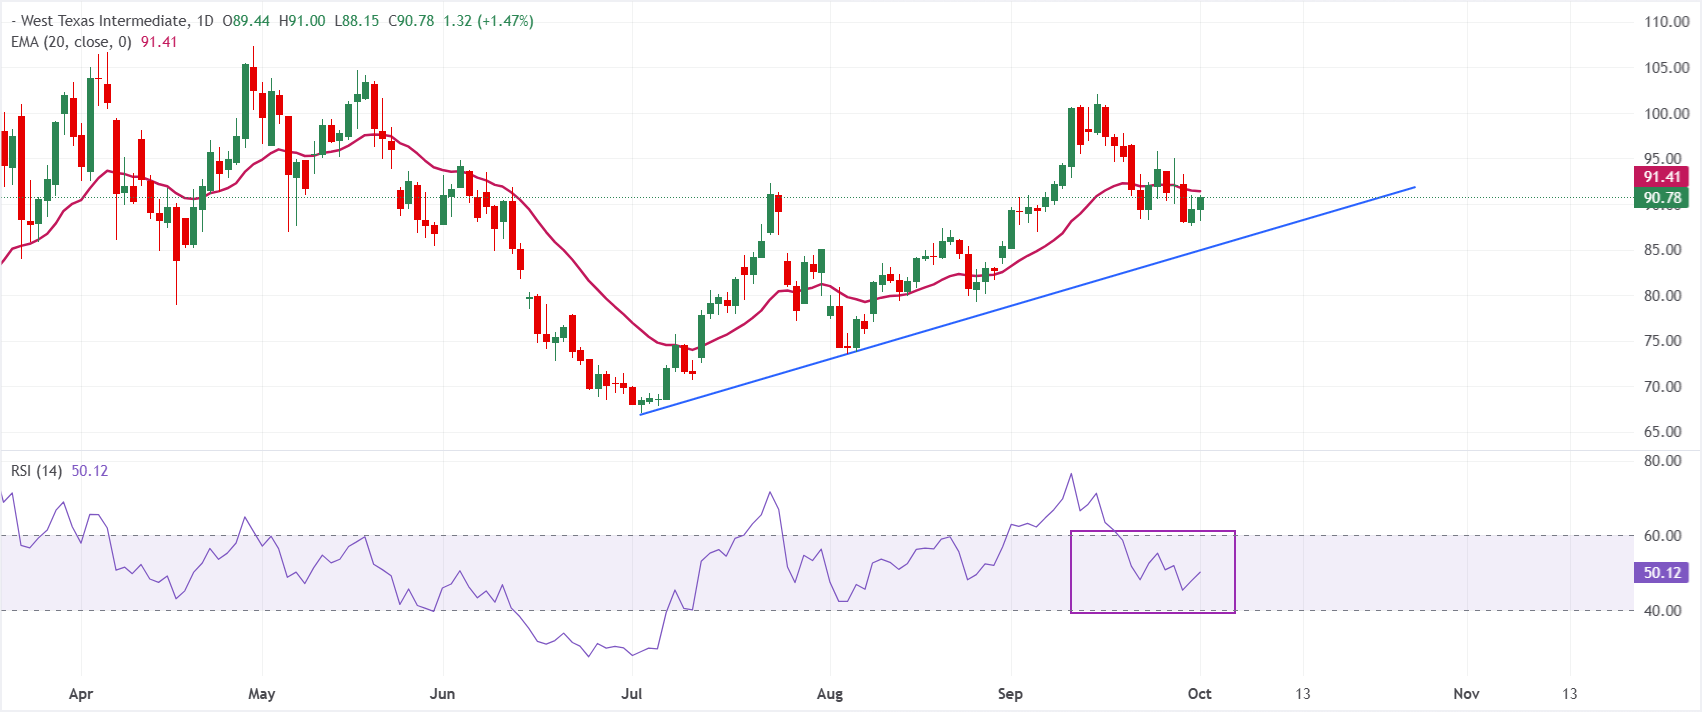
In the daily chart, WTI US Oil trades at $90.78. The near-term bias appears mildly bearish as price holds just under the 20-day Exponential Moving Average (EMA) at $91.41, hinting at a loss of immediate upside traction despite the broader uptrend. The Relative Strength Index (14) at 50.12 sits near its neutral line, suggesting a consolidative momentum backdrop where directional conviction is still limited after the recent retreat from the $100 area.
On the topside, initial resistance is located at the 20-day EMA at $91.41, and a sustained break above this barrier would reopen the path toward the recent highs. On the downside, the former breakout area and uptrend support line around $86.53 now acts as the key underlying demand zone, where a decisive move below would signal a deeper corrective phase within the broader bullish structure.
(The technical analysis of this story was written with the help of an AI tool. Know more.)
WTI Oil FAQs
WTI Oil is a type of Crude Oil sold on international markets. The WTI stands for West Texas Intermediate, one of three major types including Brent and Dubai Crude. WTI is also referred to as “light” and “sweet” because of its relatively low gravity and sulfur content respectively. It is considered a high quality Oil that is easily refined. It is sourced in the United States and distributed via the Cushing hub, which is considered “The Pipeline Crossroads of the World”. It is a benchmark for the Oil market and WTI price is frequently quoted in the media.
Like all assets, supply and demand are the key drivers of WTI Oil price. As such, global growth can be a driver of increased demand and vice versa for weak global growth. Political instability, wars, and sanctions can disrupt supply and impact prices. The decisions of OPEC, a group of major Oil-producing countries, is another key driver of price. The value of the US Dollar influences the price of WTI Crude Oil, since Oil is predominantly traded in US Dollars, thus a weaker US Dollar can make Oil more affordable and vice versa.
The weekly Oil inventory reports published by the American Petroleum Institute (API) and the Energy Information Agency (EIA) impact the price of WTI Oil. Changes in inventories reflect fluctuating supply and demand. If the data shows a drop in inventories it can indicate increased demand, pushing up Oil price. Higher inventories can reflect increased supply, pushing down prices. API’s report is published every Tuesday and EIA’s the day after. Their results are usually similar, falling within 1% of each other 75% of the time. The EIA data is considered more reliable, since it is a government agency.
OPEC (Organization of the Petroleum Exporting Countries) is a group of 12 Oil-producing nations who collectively decide production quotas for member countries at twice-yearly meetings. Their decisions often impact WTI Oil prices. When OPEC decides to lower quotas, it can tighten supply, pushing up Oil prices. When OPEC increases production, it has the opposite effect. OPEC+ refers to an expanded group that includes ten extra non-OPEC members, the most notable of which is Russia.
Recommended Articles


