


Gold starts the week lower as traders await Fed verdict
- Gold starts the week under pressure as traders gear up for the Fed’s monetary policy meeting.
- Rising Oil prices, a stronger US Dollar and elevated Treasury yields weigh on the metal.
- Technically, XAU/USD remains bearish, with RSI below neutral zone and MACD in negative territory.
Gold (XAU/USD) kicks off the week on a bearish note as Federal Reserve (Fed) interest rate hike expectations dominate market sentiment ahead of the two-day monetary policy meeting starting on Tuesday. At the time of writing, XAU/USD trades around $4,295, down 1.23% on the day, after touching an intraday low of $4,278, its lowest level since August 7.
Friday’s US Consumer Price Index (CPI) report all but cemented the case for a quarter-point rate increase this week. Data released by the US Bureau of Labor Statistics showed that headline CPI rose 0.4% MoM in August, accelerating from 0.1% in July, while core CPI increased 0.3% during the same period, up from 0.2% and marking its fastest pace in four months. According to the CME FedWatch Tool, markets now price in an 86% probability of a rate hike, up from around 59.4% a week ago.
Rising Oil prices are reinforcing expectations of a hawkish Fed outcome as conflict in the Middle East continues to escalate. West Texas Intermediate (WTI) Oil trades around $99.00, near levels last seen on May 21, and has gained over 15% so far this month.
Moving to the war in the Middle East, the Iran-aligned Houthis say they have captured more strategic islands near the Bab el-Mandeb shipping route, while Saudi Arabia has shut down its East-West pipeline, which bypasses the Strait of Hormuz, following a drone attack. A meeting between Iran and Gulf Arab states due on Monday and aimed to discuss a temporary shipping framework for the Strait of Hormuz has also been postponed.
Hawkish Fed expectations and geopolitical tensions have also revived demand for the US Dollar (USD), while US Treasury yields remain elevated across the curve.
The US Dollar Index (DXY), which tracks the Greenback’s value against a basket of six major currencies, trades around 99.57, up roughly 0.50% on the day and at its highest level since September 3. Meanwhile, the benchmark 10-year US Treasury yield hovers near 4.95%, close to the three-year high of 4.99% touched last week.
Together, a stronger US Dollar and elevated Treasury yields are weighing heavily on Gold. Since the war in the Middle East broke out, the metal appears to have partly decoupled from its traditional safe-haven role, with price action increasingly driven by interest rate expectations rather than geopolitical tensions.
As a result, a Fed rate hike accompanied by hawkish guidance could leave Gold vulnerable to further weakness. Conversely, a surprise hold would likely weigh on the US Dollar and Treasury yields, giving the precious metal room to rebound.
Technical analysis: XAU/USD struggles below 100-day SMA
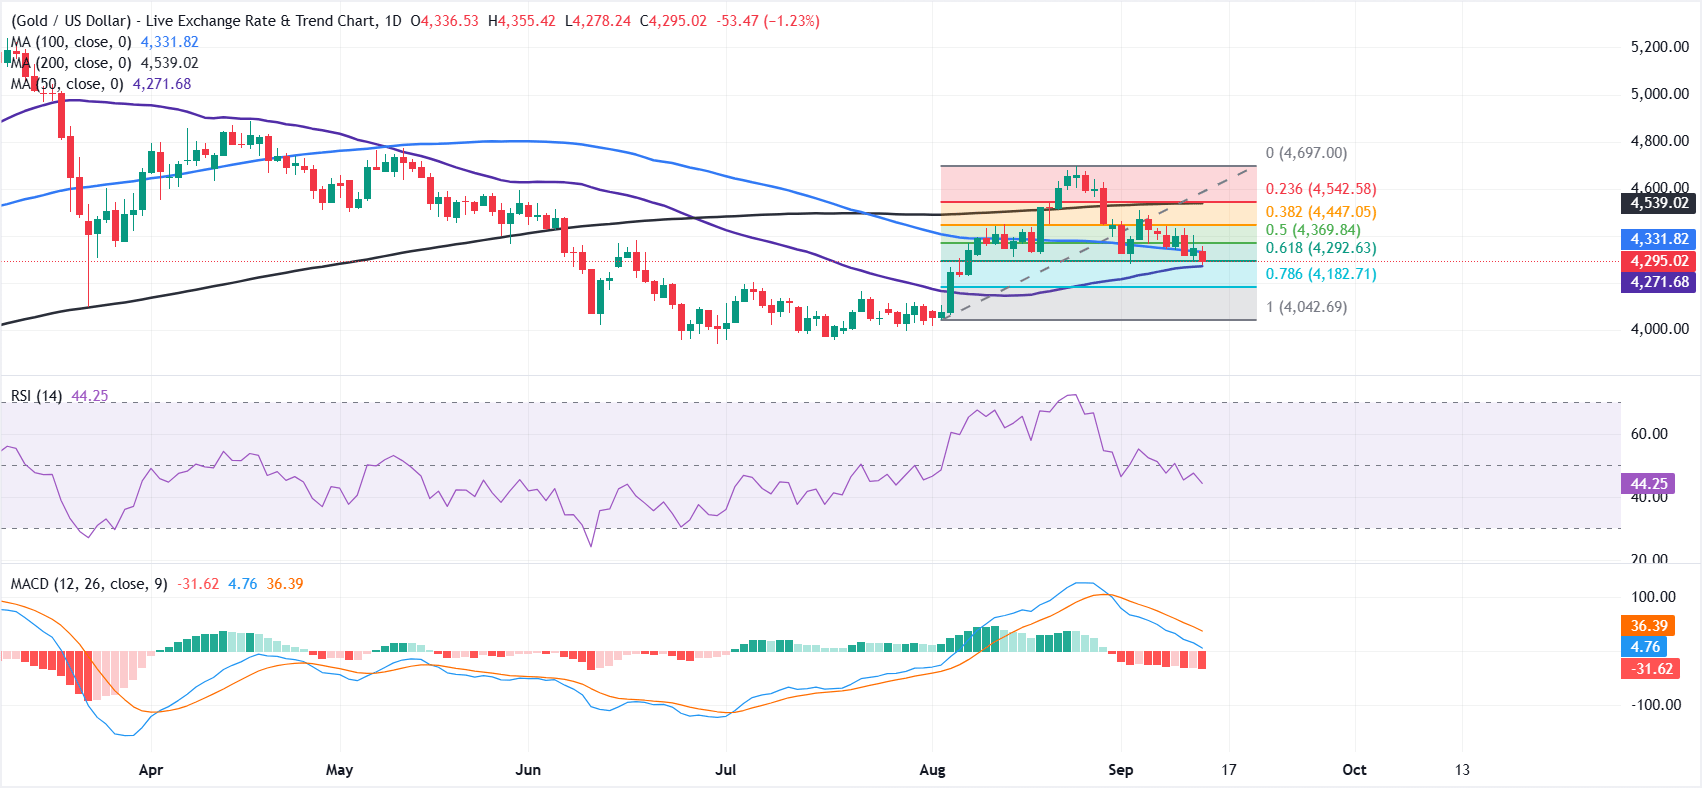
On the daily chart, XAU/USD is capped in the near term, holding beneath the 100-day Simple Moving Average (SMA) at $4,331 while only marginally above the 61.8% Fibonacci retracement at $4,292, which acts as an immediate pivot zone.
The 50-day SMA at $4,271 offers underlying trend support, but broader structure remains heavy as price stays well below the 200-day SMA. Momentum indicators reinforce this cautious tone, with the Relative Strength Index (RSI) drifting below neutral zone at 44 and the Moving Average Convergence Divergence (MACD) deep in negative territory, hinting at persistent downside pressure despite the nearby retracement floor.
On the topside, initial resistance aligns at the 100-day SMA around $4,331, followed by the 50% Fibonacci retracement near $4,369 and the denser barrier formed by the 38.2% retracement at $4,447. Further up, the 200-day SMA at $4,539 and the 23.6% retracement at $4,542 define a broader bearish cap for any stronger recovery attempts.
On the downside, a break below the 61.8% Fibonacci level near $4,293 and the 50-day SMA around $4,272 would expose the 78.6% retracement at $4,183, while the previous cycle low near the 100% retracement at $4,043 stands as a more distant structural floor.
(The technical analysis of this story was written with the help of an AI tool. Know more.)
Fed FAQs
Monetary policy in the US is shaped by the Federal Reserve (Fed). The Fed has two mandates: to achieve price stability and foster full employment. Its primary tool to achieve these goals is by adjusting interest rates. When prices are rising too quickly and inflation is above the Fed’s 2% target, it raises interest rates, increasing borrowing costs throughout the economy. This results in a stronger US Dollar (USD) as it makes the US a more attractive place for international investors to park their money. When inflation falls below 2% or the Unemployment Rate is too high, the Fed may lower interest rates to encourage borrowing, which weighs on the Greenback.
The Federal Reserve (Fed) holds eight policy meetings a year, where the Federal Open Market Committee (FOMC) assesses economic conditions and makes monetary policy decisions. The FOMC is attended by twelve Fed officials – the seven members of the Board of Governors, the president of the Federal Reserve Bank of New York, and four of the remaining eleven regional Reserve Bank presidents, who serve one-year terms on a rotating basis.
In extreme situations, the Federal Reserve may resort to a policy named Quantitative Easing (QE). QE is the process by which the Fed substantially increases the flow of credit in a stuck financial system. It is a non-standard policy measure used during crises or when inflation is extremely low. It was the Fed’s weapon of choice during the Great Financial Crisis in 2008. It involves the Fed printing more Dollars and using them to buy high grade bonds from financial institutions. QE usually weakens the US Dollar.
Quantitative tightening (QT) is the reverse process of QE, whereby the Federal Reserve stops buying bonds from financial institutions and does not reinvest the principal from the bonds it holds maturing, to purchase new bonds. It is usually positive for the value of the US Dollar.
Recommended Articles


