

Crude Oil Price Forecast: US-Iran Tensions Push Brent Crude Above $100 Mark, What's Next for Oil Prices?

Source Tradingkey

TradingKey - Escalating US-Iran Tensions Drive Oil Prices Higher as Brent Crude Crosses $100; How Will the Market Evolve?

On Thursday (September 10), international crude oil prices rose further, driven by re-escalating US-Iran tensions. Among them, WTI crude oil (USOIL) prices briefly surged past $95/barrel this morning, while Brent crude oil (UKOIL) prices breached the key $100/barrel mark, both hitting new highs since July this year.

Deteriorating geopolitical tensions are the core driver of this rally in oil prices. Recently, military skirmishes between the US and Iran in the Strait of Hormuz and the Persian Gulf region have intensified, sparking market fears that shipping through the Strait of Hormuz—a vital artery for nearly one-fifth of the world's crude oil transport—could be completely cut off.

In addition, Yemen's Houthis attacked energy facilities in Saudi Arabia, forcing a temporary halt to some local oil production operations and further worsening fears of supply disruptions in the Middle East. Meanwhile, Ukrainian drone strikes on infrastructure at Novorossiysk, a major Russian oil export terminal on the Black Sea, sounded the alarm over potential disruptions to Russian oil exports.

Currently, crude oil prices breaking $100 are reigniting market concerns over secondary inflation, which could force major central banks such as the Federal Reserve (Fed) to maintain higher interest rates for longer, thereby dampening medium-to-long-term global economic activity and energy demand. To make matters worse, the US-Iran conflict could persist, providing strong support for oil prices.

According to The Wall Street Journal, US officials stated that "senior White House advisors privately suggested to President Trump that a war with Iran could last through the remainder of his term." If so, the Strait of Hormuz could face a prolonged total blockade, potentially driving oil prices even higher. Notably, Goldman Sachs analysts pointed out that if the break above $100 is confirmed on weekly charts, upside technical room will quickly open toward the $110–$120 range.
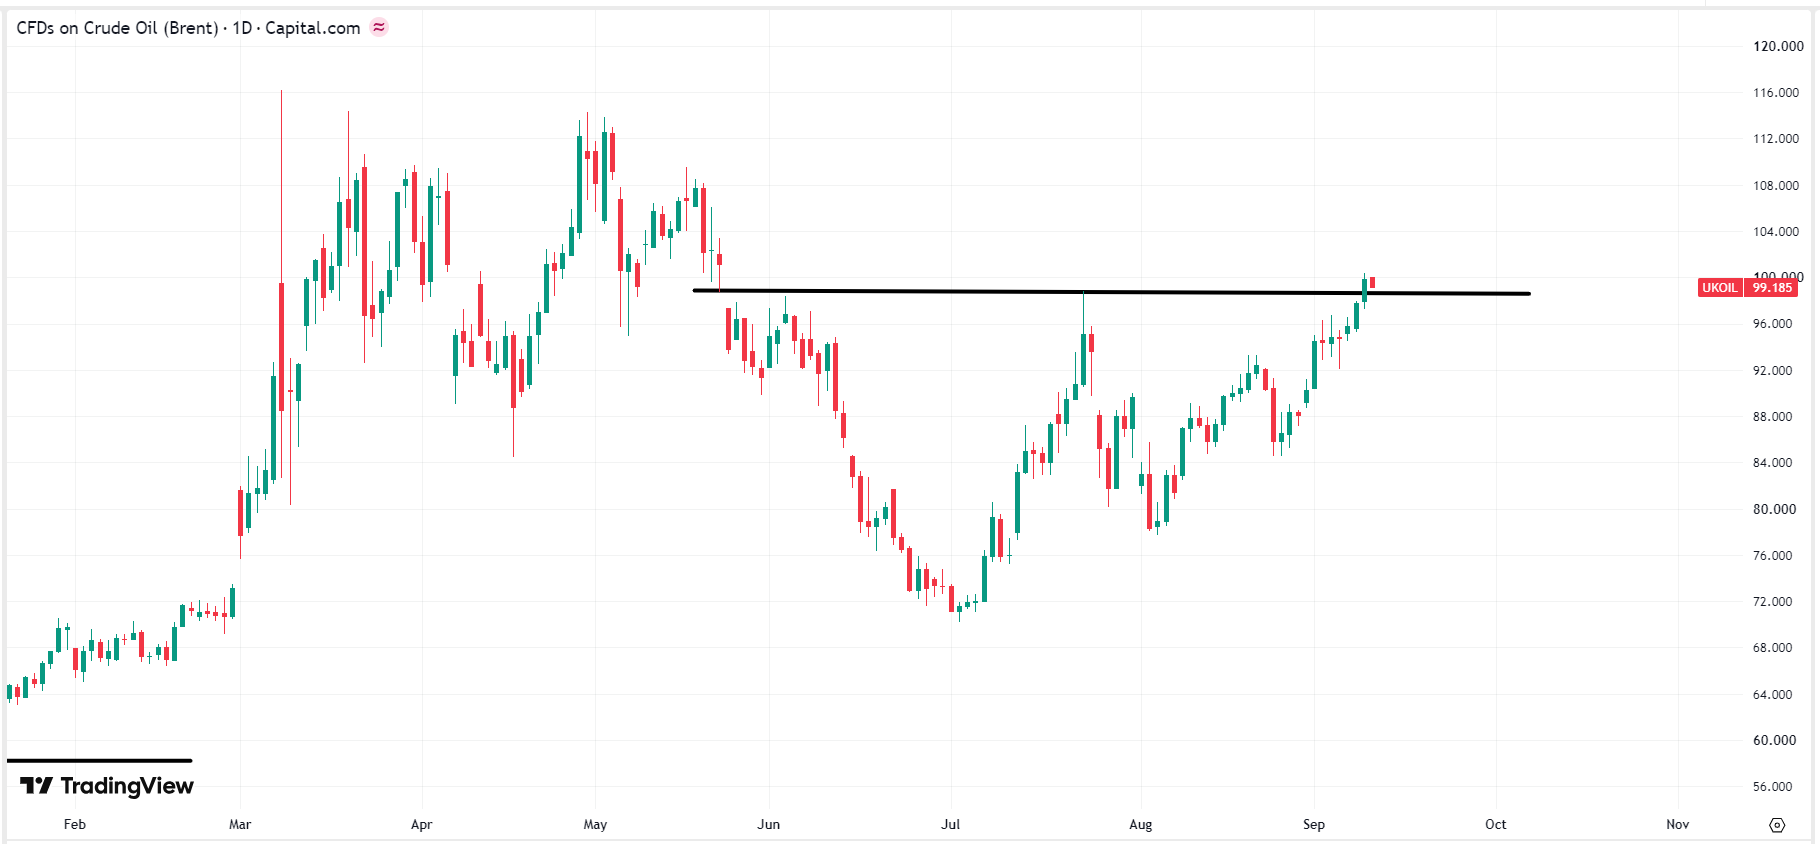
oil-wti-price-819c29f4787b46b09c5baad3159ec464Brent Crude Oil Price Chart, Source: TradingView

The prevailing market view holds that the Strait of Hormuz remains in a state of fragile operation or partial blockade, keeping risk premiums high and oil prices fluctuating within the $90–$100 range. If the US and Iran unexpectedly reach a short-term ceasefire or escort agreement and shipping traffic through the strait gradually recovers, oil prices could fall back to $75/barrel, although this scenario is considered unlikely.

Disclaimer: For information purposes only. Past performance is not indicative of future results.
placeholder
Gold Price Analysis Today: Gold Rebounds After 1.91% Drop as Yields Ease. Is $4,449 Next? Gold fell about 1.91% on August 18 before producing a strong bullish reaction from the 1-hour demand zone in early August 19 trading. RSI is recovering from oversold conditions, but Supertrend remains bearish as traders await the Fed minutes.
Author  Naoufal Seddik
Aug 19, Wed
Gold fell about 1.91% on August 18 before producing a strong bullish reaction from the 1-hour demand zone in early August 19 trading. RSI is recovering from oversold conditions, but Supertrend remains bearish as traders await the Fed minutes.
placeholder
Gold Price Analysis Today: Gold Gains 0.94% as Markets Expect Fed to Hold Rates, Can $4,449 Resistance Break? Gold gained 0.94% on August 17, closing near $4,417.30 as softer US data strengthened expectations for unchanged Fed rates in September. Gold remains bullish, with $4,449.730 resistance and $4,310.650 support in focus.
Author  Naoufal Seddik
Aug 18, Tue
Gold gained 0.94% on August 17, closing near $4,417.30 as softer US data strengthened expectations for unchanged Fed rates in September. Gold remains bullish, with $4,449.730 resistance and $4,310.650 support in focus.
placeholder
Gold Price Analysis Today: Gold Drops 1.32% Despite Lower Fed Rate-Hike Bets, Can $4,313 Support Hold? Gold fell 1.32% on August 13 after rising to $4,449.73, then reversing lower and closing near $4,349.918 below the $4,356.46 support. Softer US inflation data reduced Fed rate hike expectations, but selling pressure still dominated the session. Will $4,313 support hold?
Author  Naoufal Seddik
Aug 14, Fri
Gold fell 1.32% on August 13 after rising to $4,449.73, then reversing lower and closing near $4,349.918 below the $4,356.46 support. Softer US inflation data reduced Fed rate hike expectations, but selling pressure still dominated the session. Will $4,313 support hold?
placeholder
XAUUSD Gold Analysis: Gold Holds Above $4,350 Ahead of US Inflation Data Is $4,500 Next? Gold holds above $4,350 following weak US jobs data. As inflation reports approach and UBS eyes $5,000, can XAUUSD break resistance at $4,435 to rally toward $4,500?
Author  Naoufal Seddik
Aug 12, Wed
Gold holds above $4,350 following weak US jobs data. As inflation reports approach and UBS eyes $5,000, can XAUUSD break resistance at $4,435 to rally toward $4,500?
placeholder
Intel Price Forecast: Nvidia Picked Xeon 6, Invested $5B, Yet Analysts Still Trail INTCIntel Corporation (NASDAQ: INTC) sits at $140.05, holding firm on the ascending trendline within the 2H timeframe. The RSI indicator is currently reading 55.21, positioning it as neutral-
Author  TradingKey
Jul 02, Thu
Intel Corporation (NASDAQ: INTC) sits at $140.05, holding firm on the ascending trendline within the 2H timeframe. The RSI indicator is currently reading 55.21, positioning it as neutral-
goTop
quote