


COMEX Copper Rises 1.8%, Nearing $15,000 Mark: Will It Keep Rising?
TradingKey - As of the Asian trading session on August 26, copper futures for September delivery on the New York Mercantile Exchange (COMEX) rose 1.8% to $6.727 per pound, equivalent to approximately $14,830 per ton, surpassing the previous high of $6.7140 per pound set on August 12 to hit a new record high for the contract.
Three-month copper on the London Metal Exchange (LME) strengthened in tandem, rising to about $14,437 per ton, approaching the historical record high of $14,527.5 per ton set in January, with a price spread of about $400 per ton compared with COMEX copper.
Copper prices experienced sharp volatility this month. On August 6, the COMEX copper continuous contract briefly rose to near $6.87 per pound before pulling back under the influence of profit-taking and other factors, dropping to near $6.57 the following day. Calculated from late-July levels, copper prices gained about 6% cumulatively as of August 26, while surging more than 50% over the past year.
Weaker Dollar and Supply Disruptions Support Copper Prices
On the macroeconomic front, U.S. Treasury Secretary Bessent announced on August 19 that the single-operation limit for 10- to 30-year Treasury buyback operations would be raised from $2 billion to at least $4 billion, effective September 9 through the end of the current tax refund season (November 4). The move pushed the 30-year U.S. Treasury yield down nearly 10 basis points on the day, causing the U.S. dollar to weaken. Because copper is priced in U.S. dollars, a weaker greenback reduces purchasing costs for non-U.S. buyers, lending support to copper prices.
On the supply side, Zijin Mining stated that due to earthquakes and floods affecting the Kamoa-Kakula copper mine in the Democratic Republic of the Congo (DRC), its equity production is expected to decrease by as much as 57,000 metric tons this year, putting pressure on the company's full-year mined copper target of 1.2 million metric tons.
At the same time, however, LME copper inventories have continued to rebound recently, standing at 239,925 metric tons on August 20, up 1.67% from the previous day, while COMEX inventories surpassed 743,000 short tons, setting a new historical high. The rebound in inventories and the narrowing spot premium are key reasons for the retreat in copper prices from their monthly highs.
The distortive effect of U.S. copper tariff policies on global copper trade flows continues. In July 2025, the U.S. imposed a 50% tariff on semi-finished products such as copper pipes and copper wires, while refined copper was temporarily exempted. However, a 15% tariff on refined copper is scheduled to begin in 2027, increasing to 30% in 2028. Policy uncertainty has prompted a massive, continuous influx of refined copper into the U.S. to evade potential tariff risks, tightening tradable inventories in markets outside the U.S. and worsening regional supply-demand mismatches.
Over a longer cycle, copper fundamentals benefit from structural demand growth in electric vehicles, photovoltaics, wind power, and data center construction. However, high copper prices may also drive R&D into substitute materials and improve recycling rates, thereby dampening some demand in the medium to long term.
Looking ahead, the market will focus on U.S. PCE inflation data and Federal Reserve Chair Kevin Warsh's speech at the Jackson Hole symposium. If inflation continues to cool, the U.S. dollar and U.S. Treasury yields may come under further pressure, providing a tailwind for copper prices; if Warsh delivers hawkish signals, a dollar rebound could prompt a pullback in copper prices from high levels, leading to significant short-term price volatility.
COMEX Copper Price Technical Analysis
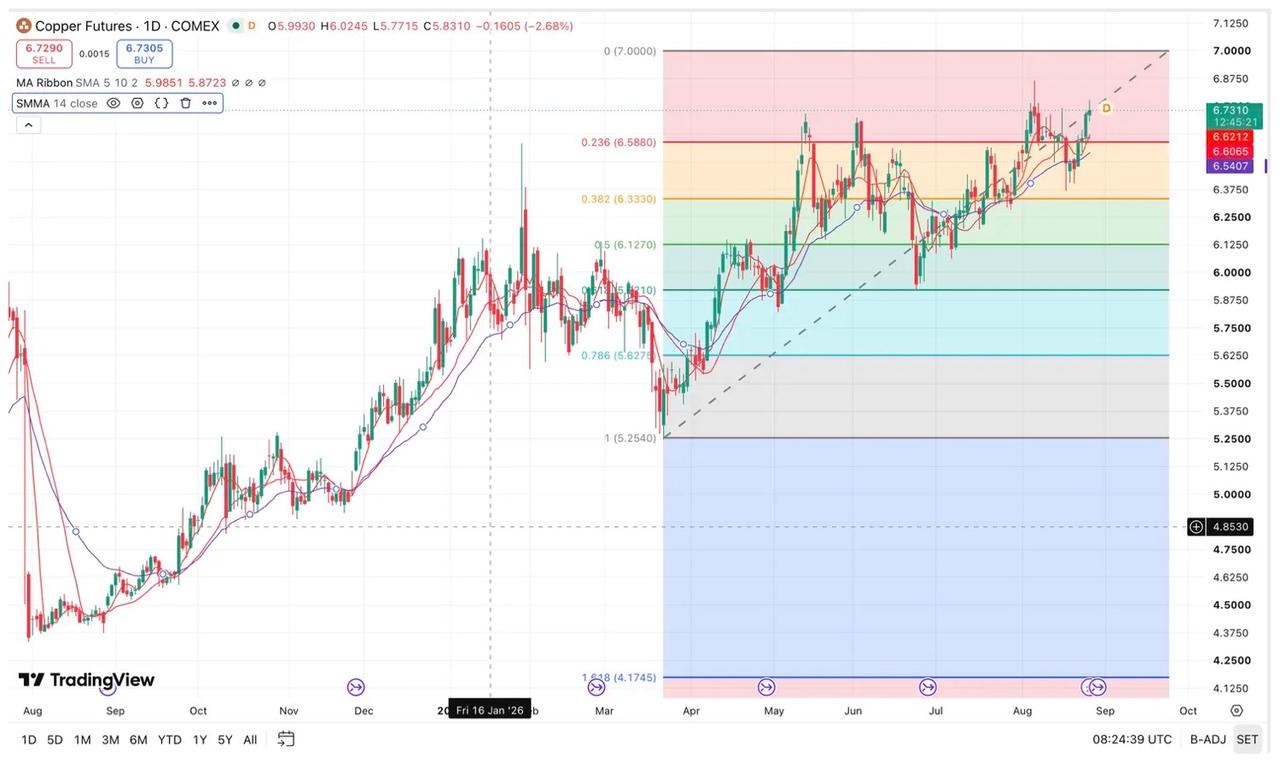
[Source: TradingView]
Looking at the COMEX copper daily chart, copper prices have steadily climbed from the year's low, touching an all-time high near $6.87/lb in early August, before correcting due to rising inventories and profit-taking. Currently, prices have rebounded to around $6.70, with the overall price center maintaining an upward trend and the bullish structure remaining intact.
Currently, copper prices face strong resistance near the $6.90 mark and have repeatedly failed to effectively break above the previous high, indicating heavy selling pressure at this level, with a high likelihood of continued high-level consolidation in the short term.
On the downside, the primary support level to watch is around $6.54, the recent pullback low. If this level fails to hold, copper prices may further test support at the 20-day moving average. A break below the 20-day moving average would pose a risk of prices falling back into the $6.30-$6.00 range.
On the upside, if copper prices can effectively break through $6.90 and hold above it, a new upside space is expected to open, challenging the $7.00 psychological mark. If the strong momentum continues, copper prices could potentially test the $7.20-$7.50 range further.
Recommended Articles


