


GBP/JPY Price Forecast: Pound dives below 208.00 following rejection at 209.00
- GBP/JPY's tests two-week lows below 208.00 after being rejected at 209.00.
- The Pound resumes its bearish trend after a mild recovery attempt during the Asian session.
- The BoJ minutes highlight an increasing concern about inflation and policymakers' willingness to accelerate rate hikes.
The British Pound (GBP) extends losses against the Japanese Yen (JPY) on Monday, following a mild recovery attempt earlier in the day. The GBP/JPY hit fresh two-week lows at the 207.70 area on Wednesday, after being rejected at 209.00 in the Asian session, highlighting a more than 1% decline over the last two trading days and nearing oversold levels on intraday charts.
The Bank of Japan (BoJ) released the minutes of July's meeting earlier on Monday, which showed that some policymakers called for faster interest rate hikes in July, in light of the mounting inflation risks. The minutes, however, failed to have any significant impact on the pair at the moment of their release.
The bank hiked interest rates in September, but the two dovish dissenters in the committee left investors pondering the ability of the BoJ to tighten its monetary policy much further and sent the Yen lower across the board.
In the UK, the Bank of England has turned hawkish with Governor Bailey and Deputy Governor Clare Lombardelli hinting at interest rate hikes ahead, although, according to HSBC analysts, “weak UK labour demand and sluggish private sector momentum could weigh on the GBP in the near term”
Apart from that, the political and fiscal backdrop is an additional source of weakness for the pound, says HSBC, noting that “the run-up to the budget update on 28 October may add further pressure, with elevated gilt yields and difficult fiscal choices ahead for the new Chancellor.”
Technical Analysis: Testing support at 207.80 with RSI approaching oversold levels
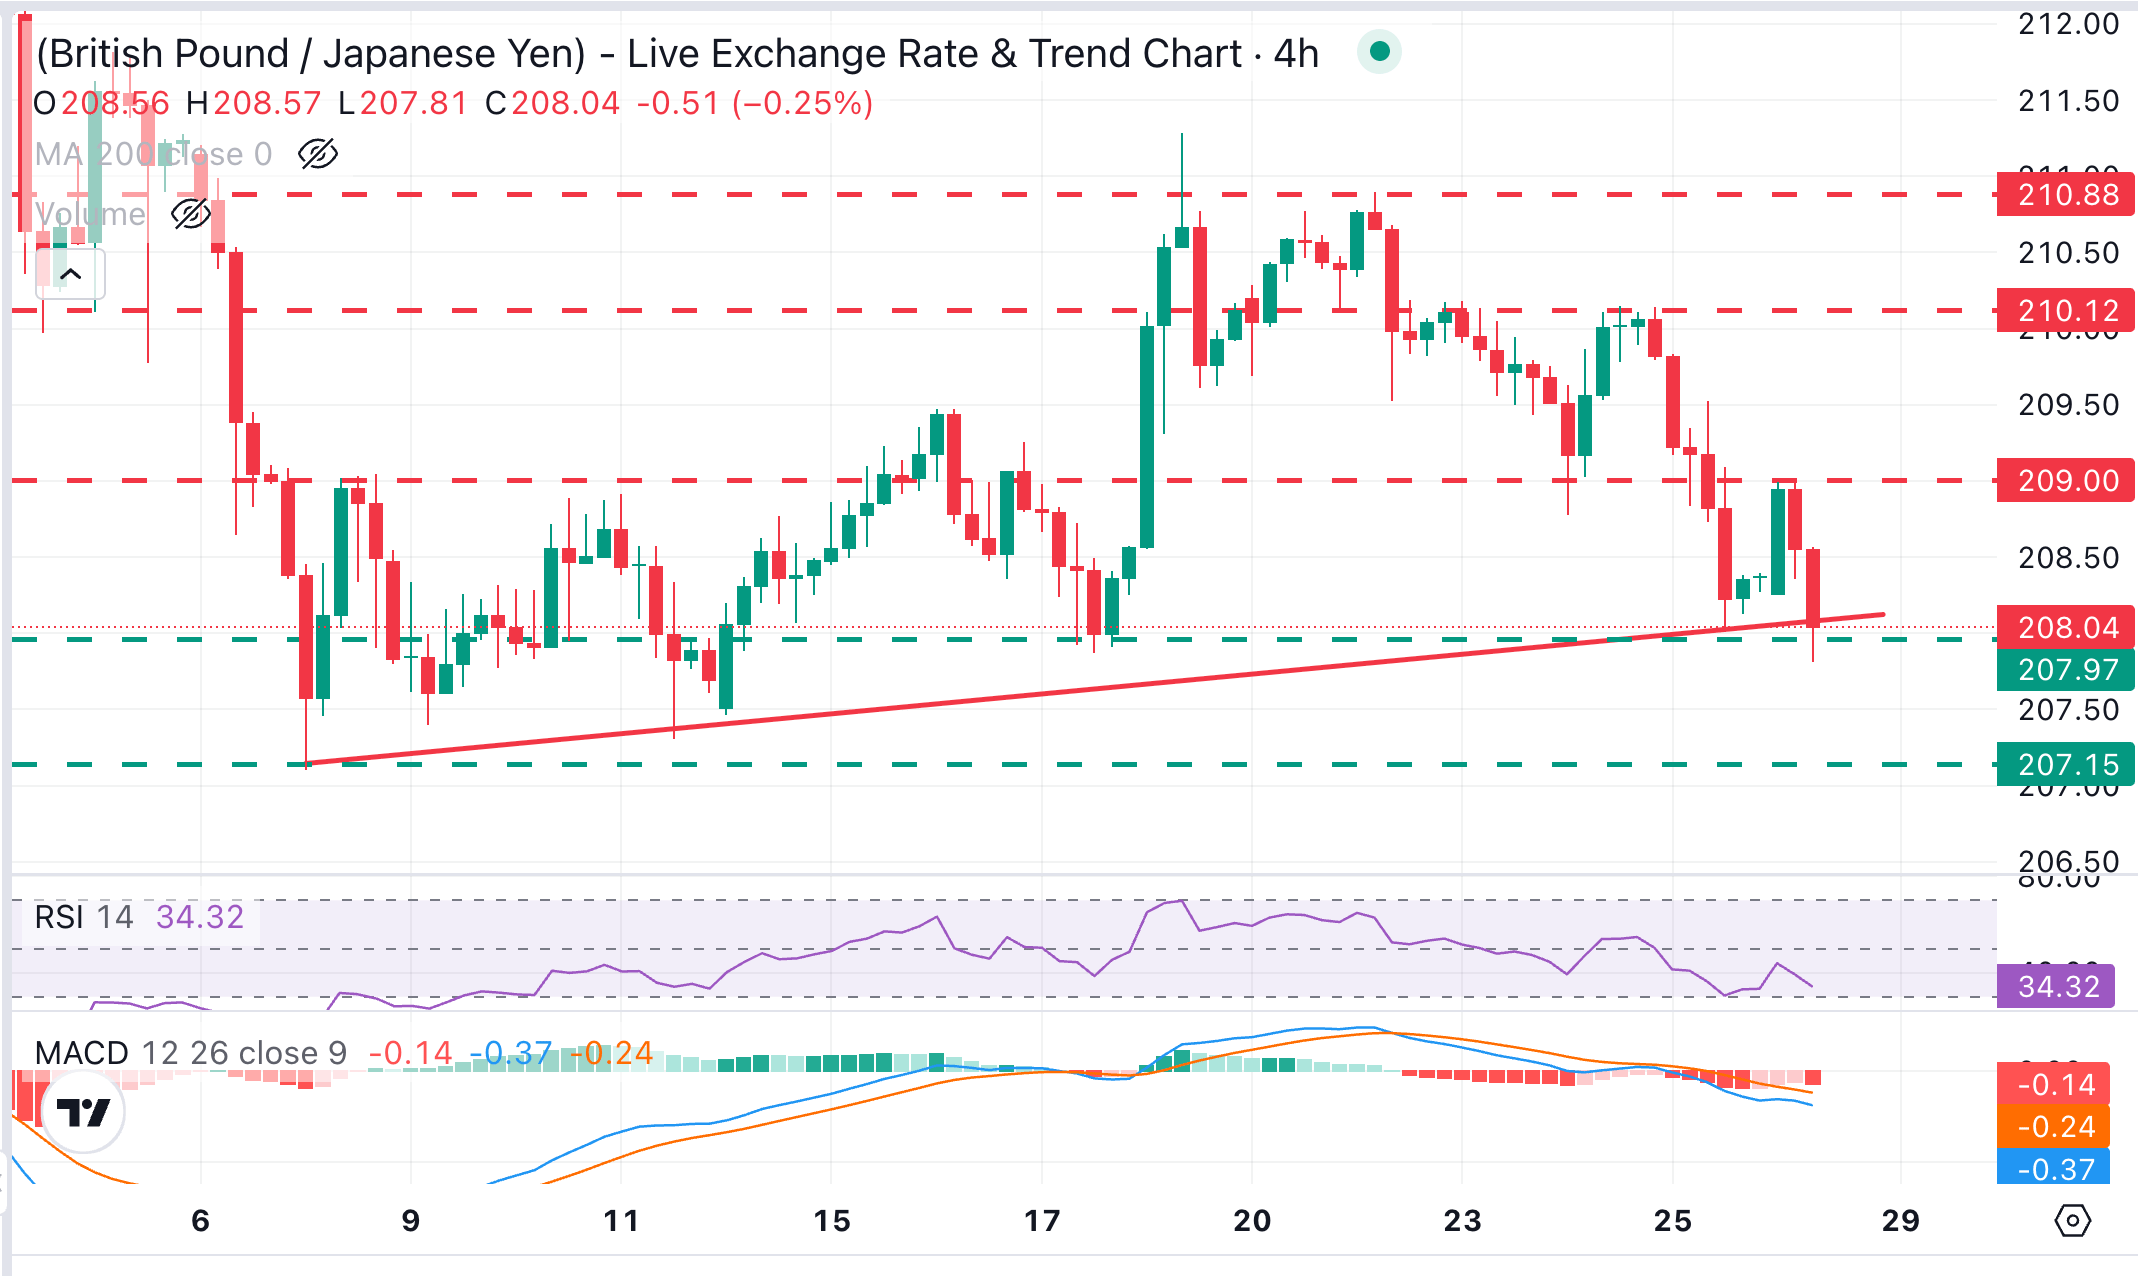
GBP/JPY trades at 208.00, holding the near-term bearish structure in place. Momentum indicators in the 4-hour chart remain bearish, with the Relative Strength Index (14) just above oversold levels and the Moving Average Convergence Divergence (MACD) histogram printing widening red bars, which suggests that upside attmepts are likely to find sellers.
Bears have pierced a trendline resistance from early September lows, at 208,10 and are now testing the support area around 207.80 (September 17 and 25 lows) with their focus on the key support area at the September 8 trough of 207.10.
On the topside, initial resistance arrives at 209.00, which has capped bulls on Monday. A clear break of that level would expose the horizontal resistance around 210.10 (September 23, 24 highs) ahead of the September 22 high at 210.90.
(The technical analysis of this story was written with the help of an AI tool. Know more.)
Pound Sterling Price Today
The table below shows the percentage change of British Pound (GBP) against listed major currencies today. British Pound was the strongest against the Swiss Franc.
| USD | EUR | GBP | JPY | CAD | AUD | NZD | CHF | |
|---|---|---|---|---|---|---|---|---|
| USD | 0.05% | -0.33% | -0.50% | 0.08% | 0.02% | -0.16% | 0.11% | |
| EUR | -0.05% | -0.22% | -0.50% | 0.07% | -0.00% | -0.07% | 0.07% | |
| GBP | 0.33% | 0.22% | -0.31% | 0.28% | 0.20% | 0.16% | 0.40% | |
| JPY | 0.50% | 0.50% | 0.31% | 0.54% | 0.47% | 0.42% | 0.70% | |
| CAD | -0.08% | -0.07% | -0.28% | -0.54% | -0.08% | -0.13% | 0.13% | |
| AUD | -0.02% | 0.00% | -0.20% | -0.47% | 0.08% | -0.07% | 0.20% | |
| NZD | 0.16% | 0.07% | -0.16% | -0.42% | 0.13% | 0.07% | 0.28% | |
| CHF | -0.11% | -0.07% | -0.40% | -0.70% | -0.13% | -0.20% | -0.28% |
The heat map shows percentage changes of major currencies against each other. The base currency is picked from the left column, while the quote currency is picked from the top row. For example, if you pick the British Pound from the left column and move along the horizontal line to the US Dollar, the percentage change displayed in the box will represent GBP (base)/USD (quote).
Recommended Articles


