


Euro remains muted after mixed German flash PMI data
- Euro remains calm after the release of the German preliminary HCOB PMI data for September.
- German HCOB Composite PMI jumps to 53.8 from 51.8 in August.
- The Fed will likely deliver at least one more interest rate hike this year.
The Euro (EUR) remains almost steady against its major currency peers after the release of the German preliminary HCOB Purchasing Managers’ Index (PMI) data for September.
The PMI report has shown a slowdown in the manufacturing sector output; however, the services sector activity returns to the expansion territory. The Manufacturing PMI arrived at 53.8, lower than 54.5 estimates and the previous reading of 54.3. The Services PMI jumped to 52.9 from 49.7 in August. A figure above 50.0 is considered as expansion in the business activity.
Strong service sector activity led to a significant growth in the overall business activity. The Composite PMI rises to 53.8 from 51.8 in August.
Against the US Dollar (USD), the Euro is down 0.24% to near 1.1420. The major currency pair is under pressure as the US Dollar remains broadly firm, with the Federal Reserve (Fed) being widely anticipated to hike interest rates at least one more time in the remainder of the year.
US Dollar Price Today
The table below shows the percentage change of US Dollar (USD) against listed major currencies today. US Dollar was the strongest against the New Zealand Dollar.
| USD | EUR | GBP | JPY | CAD | AUD | NZD | CHF | |
|---|---|---|---|---|---|---|---|---|
| USD | 0.23% | 0.28% | 0.27% | 0.13% | 0.41% | 0.41% | 0.17% | |
| EUR | -0.23% | 0.04% | 0.04% | -0.08% | 0.19% | 0.17% | -0.06% | |
| GBP | -0.28% | -0.04% | 0.02% | -0.13% | 0.14% | 0.14% | -0.03% | |
| JPY | -0.27% | -0.04% | -0.02% | -0.11% | 0.13% | 0.16% | -0.02% | |
| CAD | -0.13% | 0.08% | 0.13% | 0.11% | 0.26% | 0.28% | 0.09% | |
| AUD | -0.41% | -0.19% | -0.14% | -0.13% | -0.26% | 0.00% | -0.16% | |
| NZD | -0.41% | -0.17% | -0.14% | -0.16% | -0.28% | -0.00% | -0.18% | |
| CHF | -0.17% | 0.06% | 0.03% | 0.02% | -0.09% | 0.16% | 0.18% |
The heat map shows percentage changes of major currencies against each other. The base currency is picked from the left column, while the quote currency is picked from the top row. For example, if you pick the US Dollar from the left column and move along the horizontal line to the Japanese Yen, the percentage change displayed in the box will represent USD (base)/JPY (quote).
During press time, the US Dollar Index (DXY), which gauges the Greenback’s value against six major currencies, trades 0.23% higher to near 100.77, the highest level seen in over seven weeks.
Fed policymakers continue to warn of persistent inflation risks amid energy shocks and strong demand, advocating the need of more interest rate hikes.
“The risks to inflation outweigh the risks to maximum employment. That's why we raised rates,” Richmond Fed Bank President Thomas Barkin said on Tuesday, Reuters reported. Barkin added, "Will additional hikes be required, and how many? We'll see," Barkin said.
EUR/USD Technical Analysis
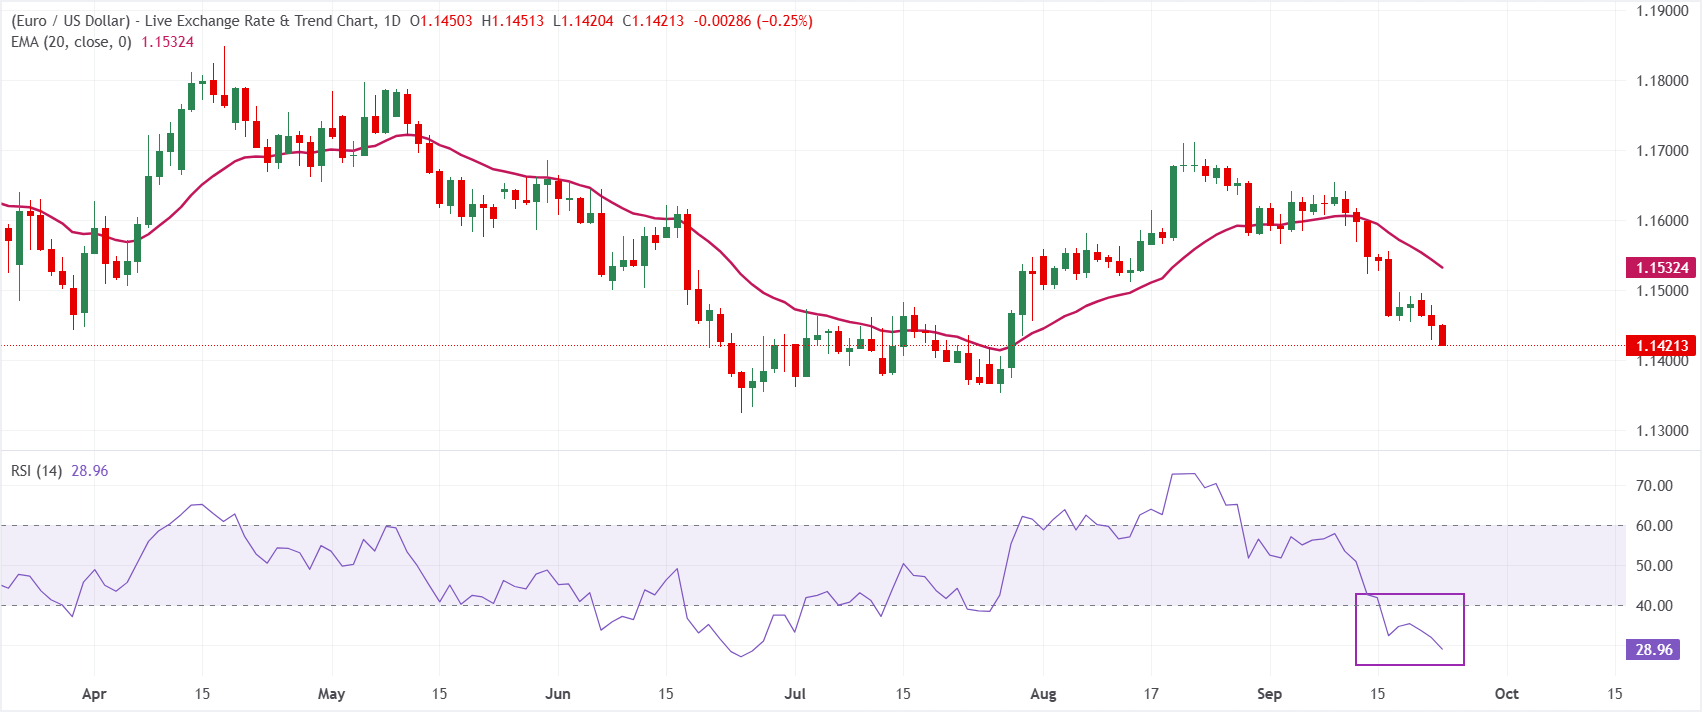
In the daily chart, EUR/USD trades at 1.1422, keeping a bearish near-term bias as spot holds beneath the 20-period exponential moving average (EMA) at 1.1532. The pair has extended its retreat away from prior highs, and the latest Relative Strength Index (RSI) reading near 29 suggests emerging oversold conditions, hinting that downside momentum could be stretched even as the broader tone remains heavy below the key EMA barrier.
On the topside, initial resistance is located at the 20-period EMA at 1.1532, which caps recovery attempts and defines the first hurdle for any corrective bounce. As long as price trades under this moving average, rallies are likely to be viewed as corrective within a broader bearish phase, while any sustained break above the EMA would be needed to ease immediate pressure and open the way for a more durable rebound.
(The technical analysis of this story was written with the help of an AI tool. Know more.)
Economic Indicator
HCOB Composite PMI
The Composite Purchasing Managers Index (PMI), released on a monthly basis by S&P Global and Hamburg Commercial Bank (HCOB), is a leading indicator gauging private-business activity in Germany for both the manufacturing and services sectors. The data is derived from surveys to senior executives. Each response is weighted according to the size of the company and its contribution to total manufacturing or services output accounted for by the sub-sector to which that company belongs. Survey responses reflect the change, if any, in the current month compared to the previous month and can anticipate changing trends in official data series such as Gross Domestic Product (GDP), industrial production, employment and inflation. The index varies between 0 and 100, with levels of 50.0 signaling no change over the previous month. A reading above 50 indicates that the German private economy is generally expanding, a bullish sign for the Euro (EUR). Meanwhile, a reading below 50 signals that activity is generally declining, which is seen as bearish for EUR.
Read more.Last release: Wed Sep 23, 2026 07:30 (Prel)
Frequency: Monthly
Actual: 53.8
Consensus: -
Previous: 51.8
Source: S&P Global
Recommended Articles


