

GBP/JPY Price Forecast: Rebounds above 207.00 as oversold risk eases

Source Fxstreet
  • GBP/JPY recovers as RSI climbs away from oversold territory.
  • Break above 209.58 could reopen the path toward 210.00.
  • Bulls need 213.22 reclaimed to challenge broader bearish trend.

The GBP/JPY edges higher by about 0.29% on Tuesday, even as risk appetite has shifted to the sour side due to geopolitical developments that are driving global bond yields higher amid inflation fears. At the time of writing, the cross-pair trades at 209.02 after bouncing off daily lows of 208.25.

GBP/JPY Price Forecast: Technical Outlook

Price action in the daily chart shows that the cross is trending lower, following two interventions in the FX markets. This sent GBP/JPY tumbling from around yearly highs near 220.00 to current spot prices, for a loss of over 1,300 pips.

The Relative Strength Index (RSI) remains bearish, though momentum tilted modestly upwards after the index crossed from below 30 to nearly 34. Hence, in the short term, GBP/JPY could aim higher, challenging key resistance levels.

If GBP/JPY crosses the August 3 daily low of 209.58, it opens the door to test 210.00. Even though that is positive for bulls, to change the trend, they must surpass the 200-day Simple Moving Average (SMA) at 213.22, paving the way towards the 215.00 mark.

GBP/JPY Price Chart – Daily
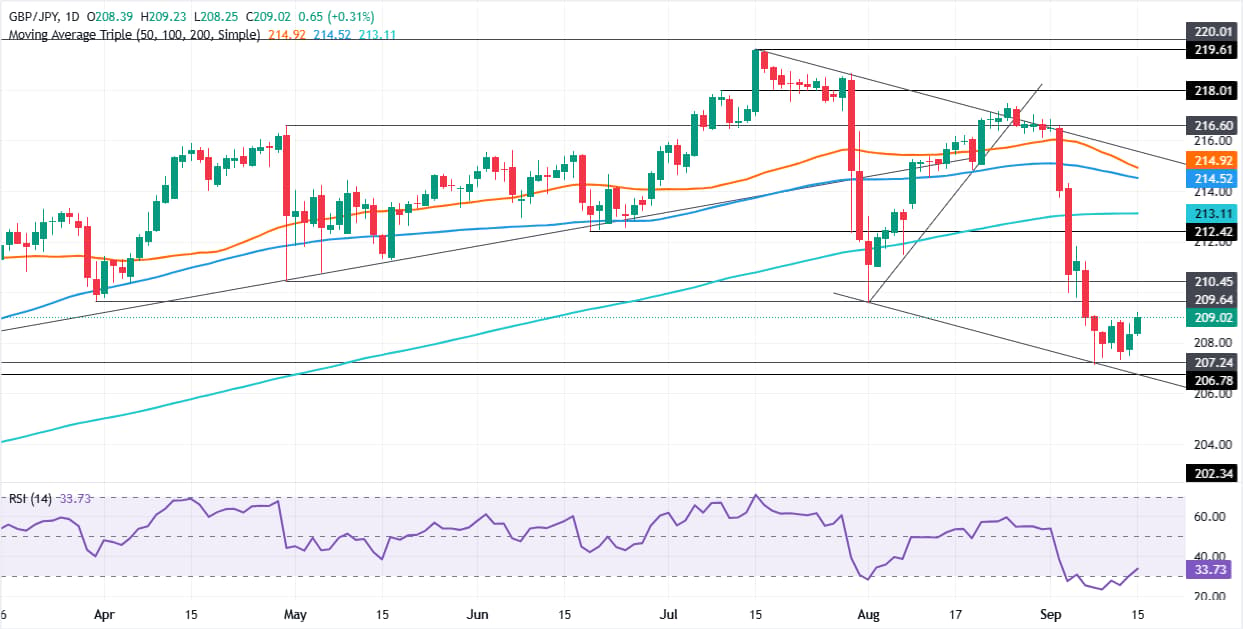
GBP/JPY daily chart

Japanese Yen Price Today

The table below shows the percentage change of Japanese Yen (JPY) against listed major currencies today. Japanese Yen was the strongest against the New Zealand Dollar.

USD EUR GBP JPY CAD AUD NZD CHF
USD 0.06% 0.16% 0.50% 0.14% 0.12% 0.30% 0.16%
EUR -0.06% 0.11% 0.43% 0.08% 0.06% 0.26% 0.11%
GBP -0.16% -0.11% 0.29% -0.05% -0.05% 0.13% -0.01%
JPY -0.50% -0.43% -0.29% -0.34% -0.35% -0.16% -0.31%
CAD -0.14% -0.08% 0.05% 0.34% -0.01% 0.18% 0.02%
AUD -0.12% -0.06% 0.05% 0.35% 0.01% 0.19% 0.03%
NZD -0.30% -0.26% -0.13% 0.16% -0.18% -0.19% -0.14%
CHF -0.16% -0.11% 0.00% 0.31% -0.02% -0.03% 0.14%

The heat map shows percentage changes of major currencies against each other. The base currency is picked from the left column, while the quote currency is picked from the top row. For example, if you pick the Japanese Yen from the left column and move along the horizontal line to the US Dollar, the percentage change displayed in the box will represent JPY (base)/USD (quote).

Disclaimer: For information purposes only. Past performance is not indicative of future results.
placeholder
Japan, South Korea Stocks Rise in Early Trade; Samsung, SK Hynix Soar, SoftBank, Kioxia Track GainsTradingKey - Both the KOSPI and Nikkei 225 indexes opened higher, led by gains in Samsung Electronics and SK Hynix, with SoftBank and Kioxia following suit.During the Asian session on June 30, both Ja
Author  TradingKey
Jun 30, Tue
TradingKey - Both the KOSPI and Nikkei 225 indexes opened higher, led by gains in Samsung Electronics and SK Hynix, with SoftBank and Kioxia following suit.During the Asian session on June 30, both Ja
placeholder
XRP Price Prediction for July 2026: Can Buyers Finally Break the Downtrend?XRP (XRP) price trades near $1.05, caught between a year-long downtrend and a sudden burst of buying.July has historically rewarded XRP holders. This year the month arrives with on-chain accumulation
Author  Beincrypto
Jun 30, Tue
XRP (XRP) price trades near $1.05, caught between a year-long downtrend and a sudden burst of buying.July has historically rewarded XRP holders. This year the month arrives with on-chain accumulation
placeholder
XAUUSD Gold Analysis: Gold Holds Above $4,350 Ahead of US Inflation Data Is $4,500 Next? Gold holds above $4,350 following weak US jobs data. As inflation reports approach and UBS eyes $5,000, can XAUUSD break resistance at $4,435 to rally toward $4,500?
Author  Naoufal Seddik
Aug 12, Wed
Gold holds above $4,350 following weak US jobs data. As inflation reports approach and UBS eyes $5,000, can XAUUSD break resistance at $4,435 to rally toward $4,500?
placeholder
Gold Price Analysis Today: Gold Drops 1.32% Despite Lower Fed Rate-Hike Bets, Can $4,313 Support Hold? Gold fell 1.32% on August 13 after rising to $4,449.73, then reversing lower and closing near $4,349.918 below the $4,356.46 support. Softer US inflation data reduced Fed rate hike expectations, but selling pressure still dominated the session. Will $4,313 support hold?
Author  Naoufal Seddik
Aug 14, Fri
Gold fell 1.32% on August 13 after rising to $4,449.73, then reversing lower and closing near $4,349.918 below the $4,356.46 support. Softer US inflation data reduced Fed rate hike expectations, but selling pressure still dominated the session. Will $4,313 support hold?
placeholder
Gold Price Analysis Today: Gold Gains 0.94% as Markets Expect Fed to Hold Rates, Can $4,449 Resistance Break? Gold gained 0.94% on August 17, closing near $4,417.30 as softer US data strengthened expectations for unchanged Fed rates in September. Gold remains bullish, with $4,449.730 resistance and $4,310.650 support in focus.
Author  Naoufal Seddik
Aug 18, Tue
Gold gained 0.94% on August 17, closing near $4,417.30 as softer US data strengthened expectations for unchanged Fed rates in September. Gold remains bullish, with $4,449.730 resistance and $4,310.650 support in focus.
Related Instrument
goTop
quote