


GBP/JPY Price Forecast: Bearish structure remains intact ahead of BoE and BoJ decisions
- GBP/JPY edges higher as traders gear up for the BoE and BoJ policy decisions later this week.
- The cross retains a bearish bias below key moving averages, while momentum indicators remain weak.
- Immediate support sits near 207, while the 209.32-211.79 region caps the upside.
GBP/JPY trades on the front foot on Tuesday but remains confined to a narrow range following the Japanese Yen’s (JPY) sharp rally earlier this month. Price action stays subdued as traders brace for major central bank events, with the Bank of England (BoE) announcing its policy decision on Thursday and the Bank of Japan (BoJ) following on Friday. At the time of writing, the cross trades near 209, up 0.32% on the day.
The BoE is widely expected to leave interest rates unchanged at 3.75% for a sixth consecutive meeting. Attention will therefore turn to the vote split after policymakers voted 6-3 at the previous meeting, with three members favouring a 25-basis-point (bps) hike to counter inflation risks from elevated Oil prices.
Even with rates unchanged, a more hawkish vote split could lift the British Pound (GBP). High energy prices linked to the war in the Middle East continue to cloud the inflation outlook, leaving markets positioned for a rate increase in the coming months.
On the other hand, traders are fully convinced that the BoJ will raise interest rates for the second time this year, taking the policy rate to 1.25%. Expectations that the central bank could accelerate the pace of tightening, rather than waiting around six months between moves, drove sharp gains in the Japanese Yen at the start of September.
GBP/JPY remains down roughly 3.50% so far this month. The cross could face fresh selling pressure if the BoJ signals that additional hikes may come at a faster pace, while a cautious policy outlook could allow GBP/JPY to recover some of its recent losses.
Technical analysis
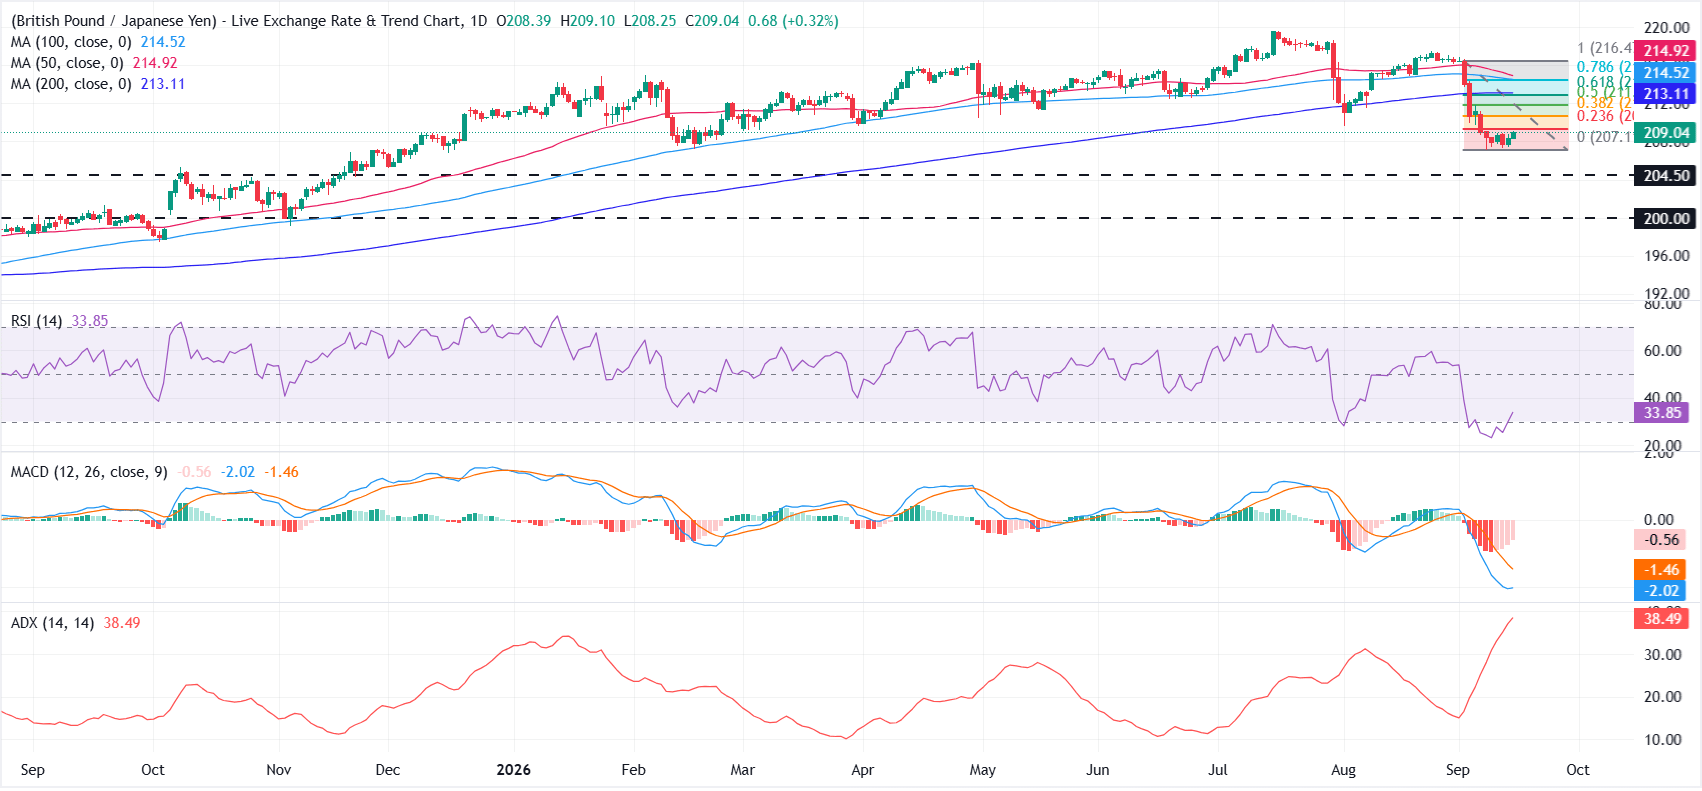
On the daily chart, GBP/JPY retains a bearish near-term bias as it holds beneath a dense band of moving average and Fibonacci resistances. Momentum stays weak, with the Relative Strength Index (RSI) recovering only modestly from oversold territory near 33 and the Moving Average Convergence Divergence (MACD) still negative, while the Average Directional Index (ADX) around 38 signals a strong downtrend.
On the topside, initial resistance is seen at the 23.6% Fibonacci retracement at 209.32, followed by a tight Fibonacci cluster between 210.69 (38.2%) and 211.79 (50.0%), which could check any rebound.
A stronger recovery would bring the 61.8% retracement at 212.90 and the 200-day Simple Moving Average (SMA) at 213.11 into focus. The 214.47-214.92 area, containing the 78.6% retracement and the 100-day and 50-day SMAs, forms a firm resistance zone. Only a sustained break above this band would ease the current bearish tone.
On the downside, the recent swing low around 207 acts as immediate support. A decisive break below this level would reinforce the bearish bias and expose the 204.50 area, followed by the psychological 200 mark.
(The technical analysis of this story was written with the help of an AI tool. Know more.)
US Dollar Price Today
The table below shows the percentage change of US Dollar (USD) against listed major currencies today. US Dollar was the strongest against the Japanese Yen.
| USD | EUR | GBP | JPY | CAD | AUD | NZD | CHF | |
|---|---|---|---|---|---|---|---|---|
| USD | 0.08% | 0.13% | 0.47% | 0.13% | 0.20% | 0.39% | 0.13% | |
| EUR | -0.08% | 0.06% | 0.38% | 0.05% | 0.11% | 0.30% | 0.05% | |
| GBP | -0.13% | -0.06% | 0.31% | -0.03% | 0.06% | 0.23% | -0.01% | |
| JPY | -0.47% | -0.38% | -0.31% | -0.33% | -0.26% | -0.08% | -0.33% | |
| CAD | -0.13% | -0.05% | 0.03% | 0.33% | 0.07% | 0.25% | 0.00% | |
| AUD | -0.20% | -0.11% | -0.06% | 0.26% | -0.07% | 0.19% | -0.08% | |
| NZD | -0.39% | -0.30% | -0.23% | 0.08% | -0.25% | -0.19% | -0.24% | |
| CHF | -0.13% | -0.05% | 0.00% | 0.33% | -0.00% | 0.08% | 0.24% |
The heat map shows percentage changes of major currencies against each other. The base currency is picked from the left column, while the quote currency is picked from the top row. For example, if you pick the US Dollar from the left column and move along the horizontal line to the Japanese Yen, the percentage change displayed in the box will represent USD (base)/JPY (quote).
Recommended Articles


