


AUD/JPY Price Forecast: Rally extends further to near 114.30 as hawkish RBA bets accelerate
- AUD/JPY rises to near 114.30 as fresh escalation in hawkish RBA bets strengthens the Australian Dollar.
- Higher-than-expected Australian CPI growth has prompted RBA interest rate hike expectations.
- The BoJ is highly anticipated to raise interest rates in the September policy meeting.
The Australian Dollar (AUD) trades 0.13% higher at around 114.30 against the Japanese Yen (JPY) during the European trading session on Wednesday. The cross strengthens as the Australian Dollar (AUD) outperforms, with market participants raising Reserve Bank of Australia (RBA) interest rate hike expectations, following the release of hotter-than-expected Australian Consumer Price Index (CPI) data for July.
Australian Dollar Price Today
The table below shows the percentage change of Australian Dollar (AUD) against listed major currencies today. Australian Dollar was the strongest against the New Zealand Dollar.
| USD | EUR | GBP | JPY | CAD | AUD | NZD | CHF | |
|---|---|---|---|---|---|---|---|---|
| USD | 0.01% | 0.12% | -0.16% | 0.17% | -0.24% | 0.30% | 0.23% | |
| EUR | -0.01% | 0.11% | -0.15% | 0.19% | -0.23% | 0.30% | 0.22% | |
| GBP | -0.12% | -0.11% | -0.26% | 0.05% | -0.36% | 0.20% | 0.11% | |
| JPY | 0.16% | 0.15% | 0.26% | 0.32% | -0.09% | 0.46% | 0.37% | |
| CAD | -0.17% | -0.19% | -0.05% | -0.32% | -0.41% | 0.15% | 0.06% | |
| AUD | 0.24% | 0.23% | 0.36% | 0.09% | 0.41% | 0.57% | 0.47% | |
| NZD | -0.30% | -0.30% | -0.20% | -0.46% | -0.15% | -0.57% | -0.09% | |
| CHF | -0.23% | -0.22% | -0.11% | -0.37% | -0.06% | -0.47% | 0.09% |
The heat map shows percentage changes of major currencies against each other. The base currency is picked from the left column, while the quote currency is picked from the top row. For example, if you pick the Australian Dollar from the left column and move along the horizontal line to the US Dollar, the percentage change displayed in the box will represent AUD (base)/USD (quote).
Australian inflation surprise pushes RBA hike odds sharply higher
Analysts at Deutsche Bank highlight that the latest Australian inflation data came in firmer than markets had anticipated, with the “headline CPI rise +3.5% yoy in July, down from 3.8% in June but clearly ahead of the +3.3% consensus.” They note that underlying pressures were also stronger than expected, as “trimmed mean CPI came in at +3.6% (vs. 3.5% expected).”
According to Deutsche Bank, this upside surprise has had a swift impact on policy expectations: “Following the release, traders have increased pricing of an RBA rate hike at the September 28-29 meeting from 10% to 32%.” Reflecting this shift, the bank adds that “our Australian economist has now moved to expect a 25bps September hike by the RBA, versus his earlier call for a pause for the rest of the year (see here).”
The RBA Minutes of the July policy meeting released on Tuesday also showed that several board members see an interest rate hike “quite possible” if upside inflation risks crystallise.
Though the Japanese Yen (JPY) trades lower against the antipodean, the former outperforms its other key peers due to firm expectations that the Bank of Japan (BoJ) will raise interest rates in the September policy meeting.
AUD/JPY Technical Analysis
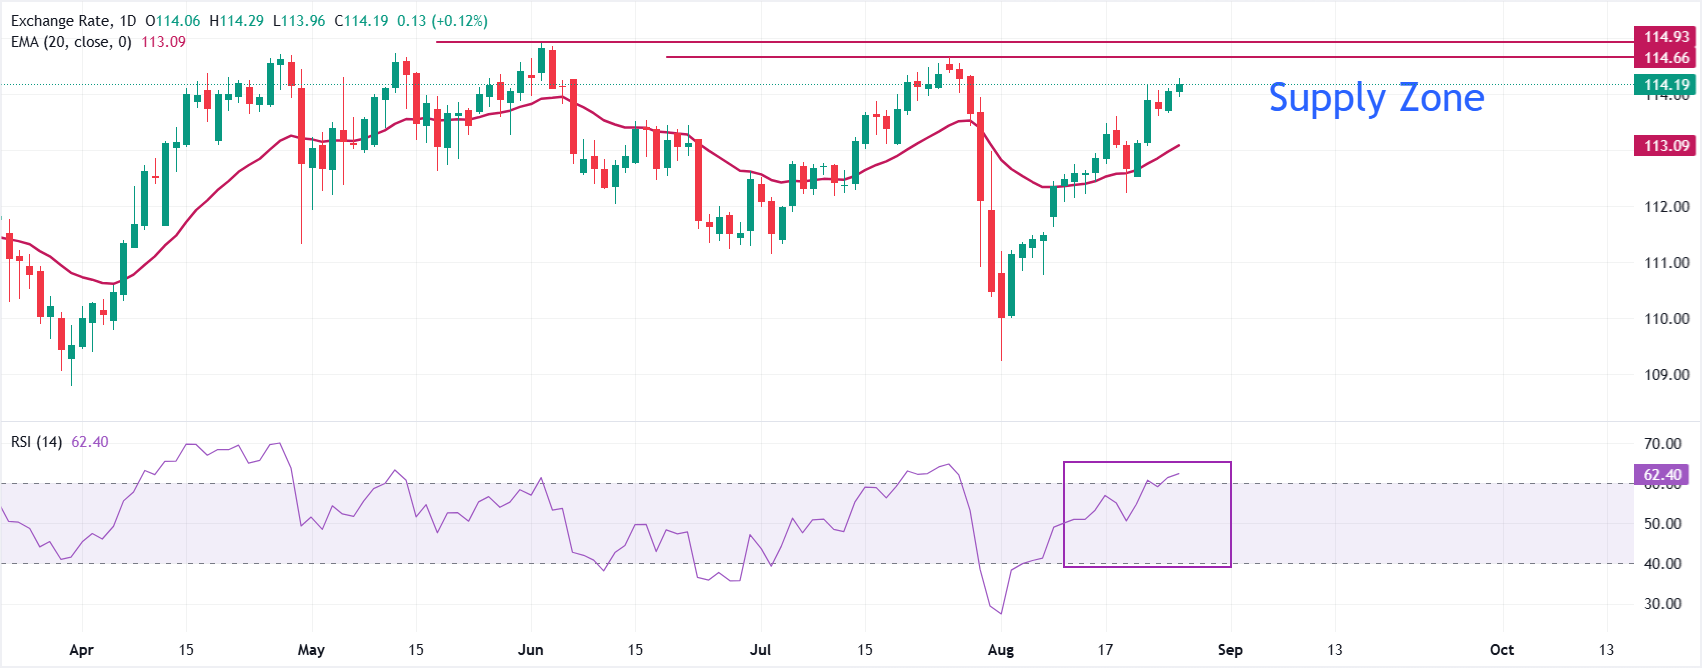
AUD/JPY trades at 114.18. The pair holds a bullish near-term bias as price advances above the 20-period exponential moving average (EMA) at 113.09, keeping the broader uptrend supported. The Relative Strength Index (RSI) at 62.38 stays in positive territory, suggesting firm buying pressure but still shy of overbought conditions.
On the downside, initial support is seen at the 20-day EMA at 113.09, which should act as a dynamic floor on pullbacks. As long as AUD/JPY defends this level, buyers are likely to retain control, with scope for the cross to grind higher while momentum remains constructive. On the upside, the 114.66-114.93 range to act as a major supply zone for the cross.
(The technical analysis of this story was written with the help of an AI tool. Know more.)
Economic Indicator
Consumer Price Index (YoY)
The Consumer Price Index (CPI), released by the Australian Bureau of Statistics on a monthly basis, measures the changes in the price of a comprehensive basket of goods and services acquired by household consumers. The indicator is the primary measure of headline inflation after a new methodology was applied to transition from quarterly to monthly readings, applying to data from April 2024 onwards. The YoY reading compares prices in the reference month to the same month a year earlier. A high reading is seen as bullish for the Australian Dollar (AUD), while a low reading is seen as bearish.
Read more.Last release: Wed Aug 26, 2026 01:30
Frequency: Monthly
Actual: 3.5%
Consensus: 3.2%
Previous: 3.8%
Source: Australian Bureau of Statistics
Recommended Articles


