


GBP/USD Price Forecast: More upside expected above 1.3570
- GBP/USD rises to near 1.3557 as the US Dollar faces selling pressure.
- The Fed is expected to leave interest rates unchanged in September.
- UK’s headline CPI grew in line with estimates of 2.9% YoY vs. 2.6% prior.
The British Pound (GBP) is up 0.2% to near 1.3557 against the US Dollar (USD) during the European trading session on Wednesday. The GBP/USD pair trades higher as the US Dollar faces selling pressure, with traders scaling back Federal Reserve (Fed) interest rate hike bets due to weak United States (US) economic data for August.
US Dollar Price Today
The table below shows the percentage change of US Dollar (USD) against listed major currencies today. US Dollar was the weakest against the Japanese Yen.
| USD | EUR | GBP | JPY | CAD | AUD | NZD | CHF | |
|---|---|---|---|---|---|---|---|---|
| USD | -0.29% | -0.20% | -0.37% | -0.22% | 0.10% | -0.13% | -0.29% | |
| EUR | 0.29% | 0.08% | -0.07% | 0.09% | 0.39% | 0.14% | 0.01% | |
| GBP | 0.20% | -0.08% | -0.13% | 0.00% | 0.34% | 0.07% | -0.08% | |
| JPY | 0.37% | 0.07% | 0.13% | 0.15% | 0.45% | 0.21% | 0.06% | |
| CAD | 0.22% | -0.09% | -0.00% | -0.15% | 0.30% | 0.06% | -0.09% | |
| AUD | -0.10% | -0.39% | -0.34% | -0.45% | -0.30% | -0.24% | -0.37% | |
| NZD | 0.13% | -0.14% | -0.07% | -0.21% | -0.06% | 0.24% | -0.14% | |
| CHF | 0.29% | -0.01% | 0.08% | -0.06% | 0.09% | 0.37% | 0.14% |
The heat map shows percentage changes of major currencies against each other. The base currency is picked from the left column, while the quote currency is picked from the top row. For example, if you pick the US Dollar from the left column and move along the horizontal line to the Japanese Yen, the percentage change displayed in the box will represent USD (base)/JPY (quote).
Meanwhile, investors await the Federal Open Market Committee (FOMC) minutes of the July policy meeting, which will be published at 18:00 GMT.
Dollar steadies as FOMC minutes eyed for limited hawkish surprise
Analysts at ING highlight that “for today, the focus will be on tonight's release of the FOMC minutes for the July meeting,” noting that the earlier decision saw “the vote… 9-3 for unchanged rates and the event proved a dovish one for the short end of the US curve and the Dollar, while the long end sold off.” ING argues that “the suspicion is that the 12-member FOMC is less hawkish than the participants whose projections delivered forecasts of a 9:9 split for a hike in the June set of Dot Plots.” As a result, while they concede “there may be a few hawkish references in tonight's minutes that could nudge the Dollar and short-dated rates a little firmer,” they stress that “we do not see the minutes as a game changer.”
Ahead of the FOMC minutes, the US Dollar Index (DXY), which gauges the Greenback’s value against six major currencies, trades 0.26% lower to near 99.38, close to its two-month low of 99.29 posted on Monday.
On the United Kingdom (UK) front, the headline Consumer Price Index (CPI) data for July has come in higher at 2.9% Year-on-Year (YoY), as expected, from 2.6% in June. The core CPI growth remains steady at 2.6% YoY, while it was expected to cool down to 2.5%.
GBP/USD Technical Analysis
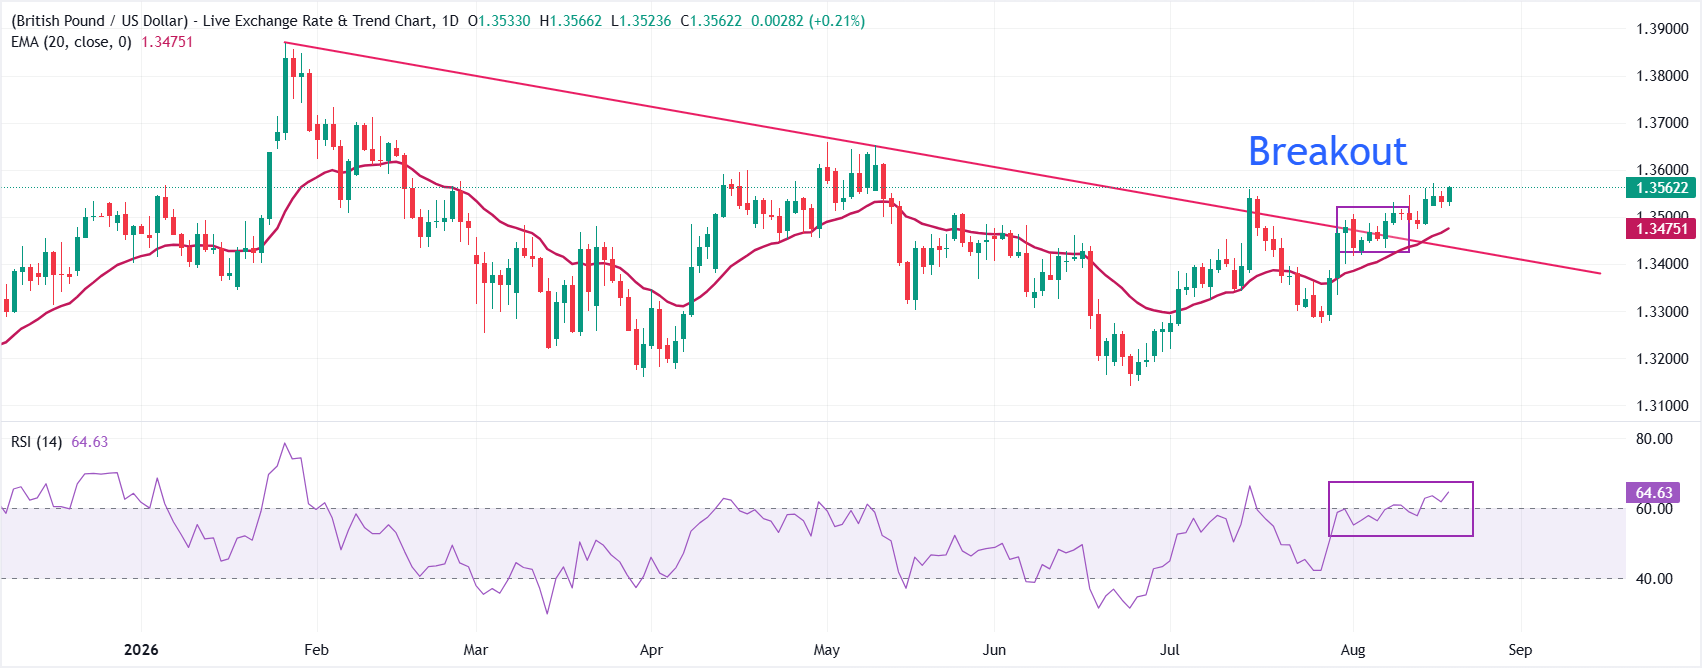
GBP/USD trades near 1.3560. The pair maintains a bullish near-term bias as spot holds above the 20-day exponential moving average (EMA) at 1.3475 and the former resistance trend line, now acting as support around 1.3436.
The Relative Strength Index (14) near 64 stays in positive territory, hinting at sustained upward momentum without yet reaching extreme overbought conditions.
On the downside, the immediate support emerges at the 20-day EMA at 1.3475, followed by the trend-line break level near 1.3436. On the topside, the pair needs to break above the three-month high at 1.3571 to extend the advance towards 1.3600, followed by the May high at 1.3658.
(The technical analysis of this story was written with the help of an AI tool. Know more.)
Economic Indicator
Consumer Price Index (YoY)
The United Kingdom (UK) Consumer Price Index (CPI), released by the Office for National Statistics on a monthly basis, is a measure of consumer price inflation – the rate at which the prices of goods and services bought by households rise or fall – produced to international standards. It is the inflation measure used in the government’s target. The YoY reading compares prices in the reference month to a year earlier. Generally, a high reading is seen as bullish for the Pound Sterling (GBP), while a low reading is seen as bearish.
Read more.Last release: Wed Aug 19, 2026 06:00
Frequency: Monthly
Actual: 2.9%
Consensus: 2.9%
Previous: 2.6%
Source: Office for National Statistics
The Bank of England is tasked with keeping inflation, as measured by the headline Consumer Price Index (CPI) at around 2%, giving the monthly release its importance. An increase in inflation implies a quicker and sooner increase of interest rates or the reduction of bond-buying by the BOE, which means squeezing the supply of pounds. Conversely, a drop in the pace of price rises indicates looser monetary policy. A higher-than-expected result tends to be GBP bullish.
Recommended Articles


