


BNB (BNBUSD) Is up 2.14% on Oct 19: What Do On-Chain Data and Market Sentiment Show?
BNB (BNBUSD) is up 2.14% at Oct 19 20:15(ET), now at $721.5, with a 7-day down of 3.17%.
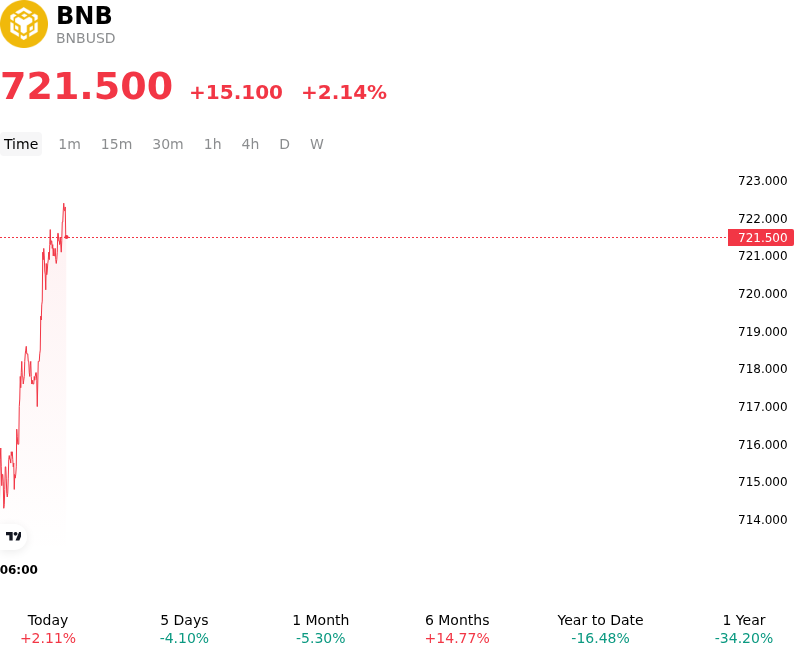
What is driving BNB (BNBUSD)’s stock price up today?
Capital inflows into BNB were primarily driven by spot accumulation and a technical rebound following a period of compressed volatility, as buyers defended strong structural support near key moving average floors. Momentum indicators reaching oversold territory prompted tactical traders to step in, triggering short-covering and renewed spot buying across major trading pairs. Derivatives market positioning reinforced this upward push, characterized by an elevated taker buy-sell ratio, net-long sentiment among top trader cohorts, and neutral funding rates. The absence of excessive leverage meant that capital flows were grounded in organic spot demand rather than speculative liquidations, allowing price action to stabilize and advance.
Ecosystem fundamentals and supply dynamics provided additional structural support for investor sentiment. Expectations surrounding the scheduled quarterly auto-burn mechanism continue to tighten the asset's circulating supply trajectory, reinforcing its long-term tokenomics framework. Concurrently, ongoing trading activity on the underlying exchange ecosystem, supported by fee-reduction initiatives and consistent launchpool activity, sustained steady utility demand for the token. This baseline of network usage helped BNB demonstrate structural resilience relative to the broader altcoin market, as institutional and retail market participants viewed recent pullbacks toward key demand zones as favorable entry points.
While near-term liquidity conditions and ecosystem-driven capital flows favor price recovery, institutional market participants continue to monitor broader macroeconomic and regulatory variables. Fluctuations in global risk appetite, driven by shifts in benchmark Treasury yields and US dollar strength, remain a primary source of broader market volatility. Furthermore, ongoing regulatory scrutiny surrounding centralized exchange platforms and cross-border digital asset compliance continues to mandate a cautious risk-management approach. For sustained upside continuation, market participants will look for continued strength in exchange trading volumes, expanding decentralized application activity on the native smart contract chain, and a favorable macro environment for risk assets.
Technical Analysis of BNB (BNBUSD)
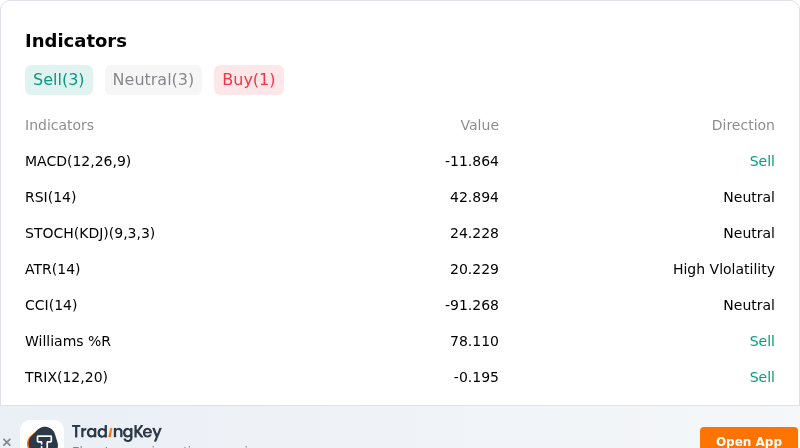
Technically, BNB (BNBUSD) shows a MACD (12,26,9) value of -11.941, indicating a sell signal. The RSI at 42.649 suggests neutral condition and the Williams %R at 78.828 suggests sell condition. Please monitor closely.
More details about BNB (BNBUSD)
Recent Events and Risks:
- Regulatory Scrutiny and Compliance Probes: Heightened scrutiny by the U.S. Department of Justice and Treasury Department concerning Binance's adherence to its 2023 settlement agreement and anti-money laundering controls has reignited legal uncertainty, creating persistent regulatory pressure on the native exchange asset.
- Technical Support Breakdown and Liquidation Risk: BNB slipped below its $750 weekly pivot and key short-term moving averages, with derivatives data highlighting concentrated long liquidation clusters around the $705–$710 support level that risk accelerating selloffs toward $680 if broken.
- Institutional Outflows and Macro Risk-Off Sentiment: Recent broader crypto market deleveraging, driven by net outflows in spot crypto funds and macroeconomic headwinds from persistent U.S. inflation data, has dampened trading volumes and reduced buying pressure across major Layer-1 ecosystem tokens.
- Platform Centralization and Ecosystem Exposure: Because BNB's liquidity and utility are tightly bound to Binance, any sudden exchange-related operational friction, market maker shifts, or sector rotation away from BNB Chain protocols disproportionately heightens intraday downside volatility.
Recommended Articles


