

Zcash Price Forecast: Downside risk looms as ETF outflows and falling Open Interest weigh

Source Fxstreet
  • Zcash is up nearly 3% on Monday, extending the rebound from the previous day’s low around $1,049.
  • Grayscale’s Zcash ETF recorded its third consecutive weekly outflow of $19.15 million, suggesting increased investor redemptions.
  • The steady decline in ZEC futures Open Interest to $2.25 billion, from $2.56 billion last week, suggests reduced retail speculation.

Zcash (ZEC) edges higher on Monday after three consecutive weeks of bearish closes totaling roughly 30% losses. The privacy coin is losing institutional confidence with three straight weeks of outflows, while retail speculation eases as ZEC futures Open Interest declines to a 30-day low. The technical outlook for ZEC indicates downside risk, as the price remains capped below a cluster of overhead resistance levels.

Declining retail demand and steady ETF outflows weigh on Zcash

Zcash is seeing a steady decline in demand among institutional investors. SoSoValue data shows that Grayscale’s ZEC-focused Exchange Traded Fund (ETF) recorded $19.15 million in outflows last week, following two previous weeks of $30.72 million and $93.56 million in outflows. This indicates that the ZEC ETF is experiencing intense selling pressure as investors redeem shares.
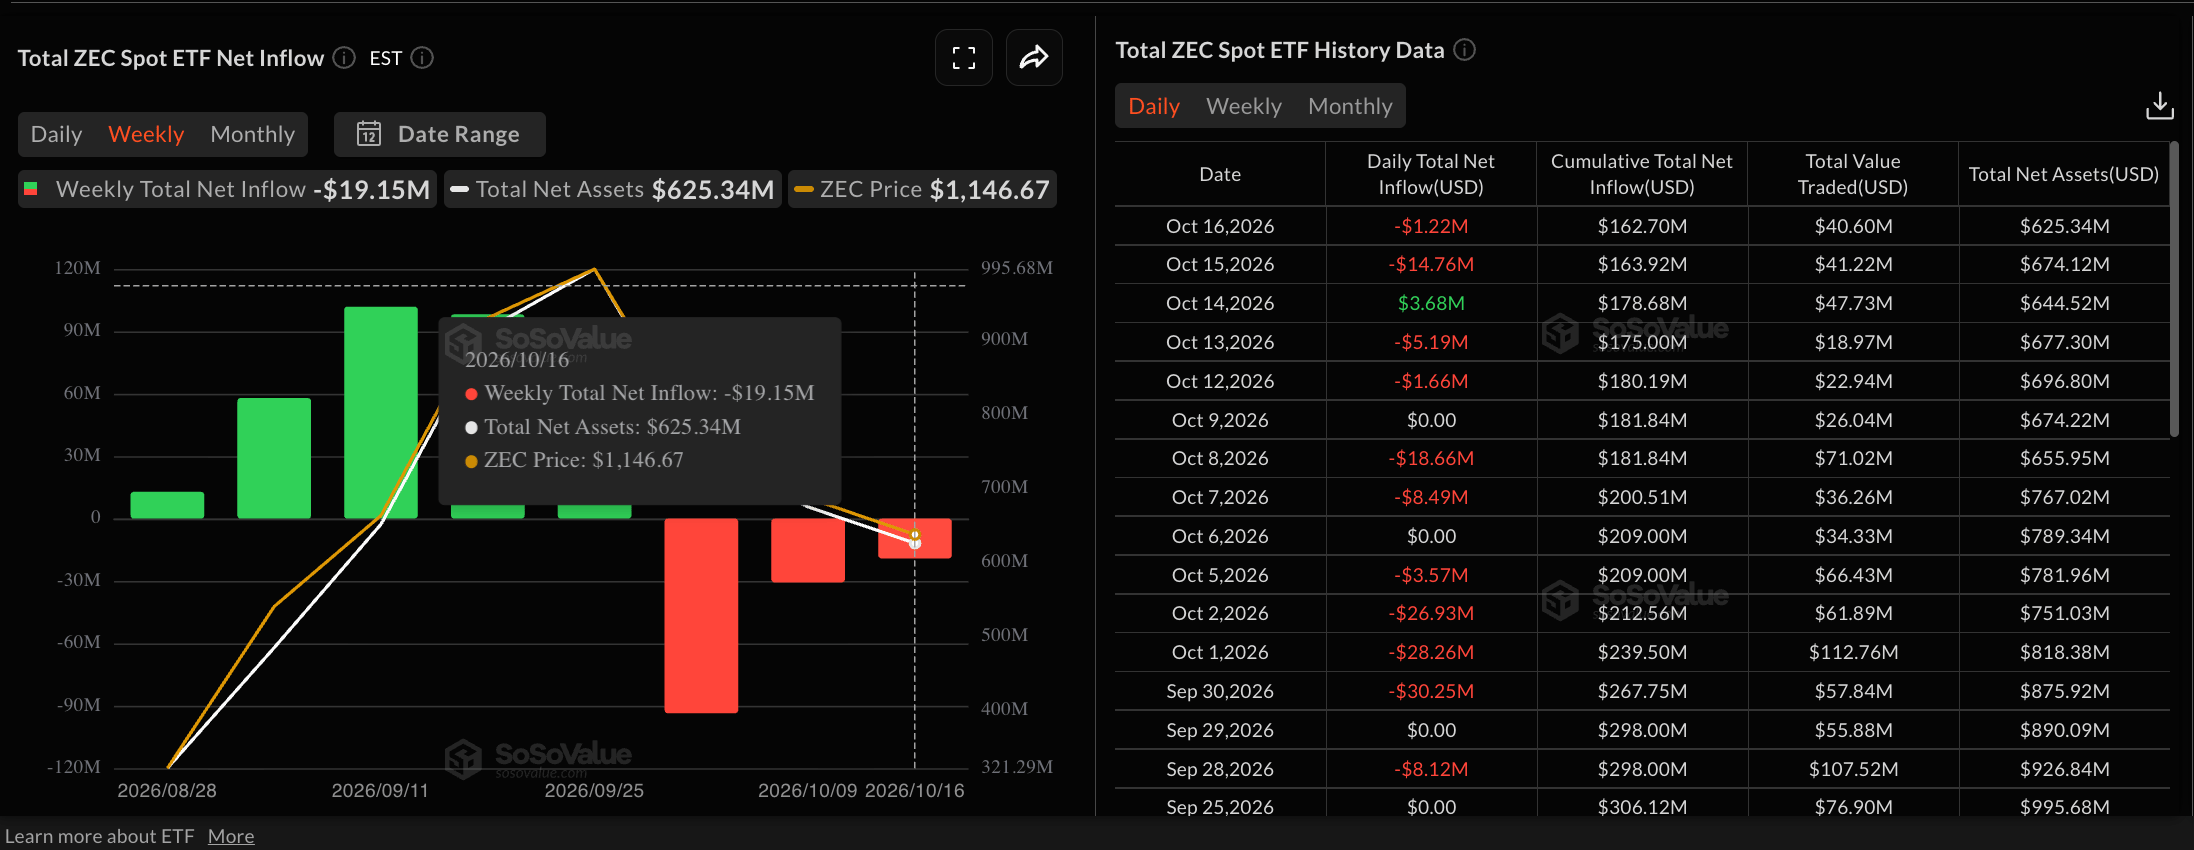
Zcash ETFs data. Source: Sosovalue

On the other hand, the retail demand for Zcash is declining. CoinGlass data shows that ZEC futures Open Interest (OI) is down to $2.25 billion from $3.29 billion last month, marking a 30-day low. This indicates that the notional value of active Zcash positions has significantly reduced, which typically implies a decline in retail interest.
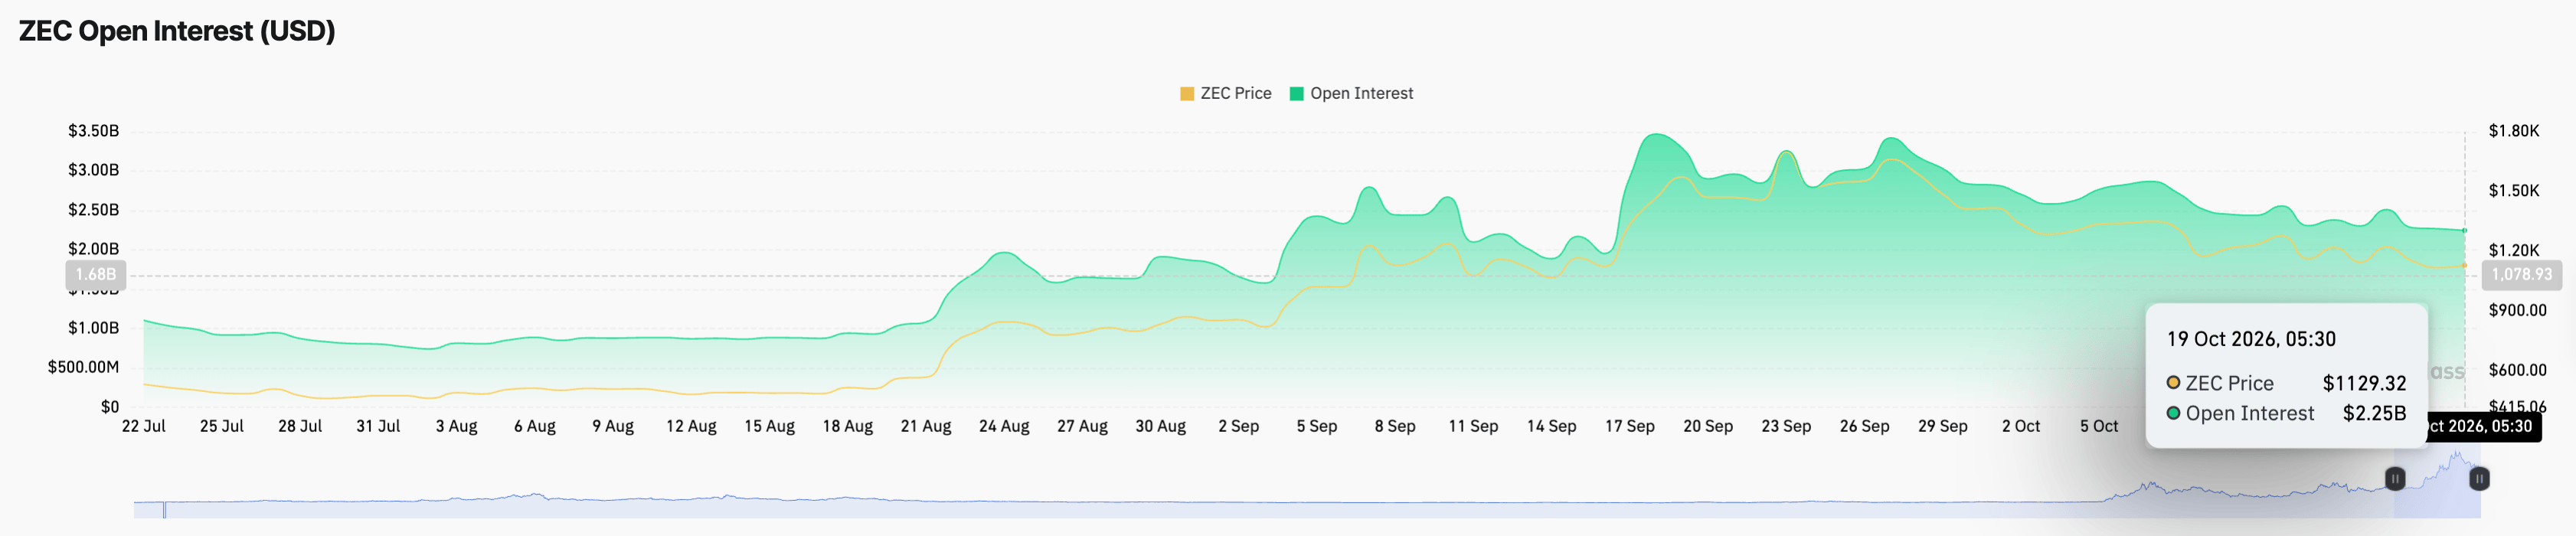
Zcash Open Interest data. Source: CoinGlass

Technical outlook: Will Zcash price drop below $1,000?

Zcash hovers around $1,158 at press time on Monday, extending mild gains after a bearish 11% close last week. The privacy coin keeps a capped near-term bias below its 50-period Exponential Moving Average (EMA) on the four-hour chart at $1,184, keeping the recent bullish attempts in check. In addition, the 200-period EMA at $1,240 sits above the short-term EMA, suggesting a corrective trend in motion.

Momentum remains neutral but fragile on the four-hour chart, with the Moving Average Convergence Divergence (MACD) marginally above its signal line in negative territory and the Relative Strength Index (RSI) near 50.

On the topside, initial resistance appears at the 50-period EMA around $1,184, with further barriers at the descending resistance trendline break level near $1,229 and then the 200-period EMA at $1,240, where a sustained break would be needed to ease the broader bearish pressure.

Chart Analysis ZEC/USDT (Binance)
ZEC/USDT four-hour price chart.

On the downside, structural support is defined by the September 4 high at $1,050, which is reinforced by the $1,000 psychological threshold. A sustained breakout below $1,000 could extend the decline toward the August 23 high at $888.

(The technical analysis of this story was written with the help of an AI tool. Know more.)

Disclaimer: For information purposes only. Past performance is not indicative of future results.
placeholder
XRP Price Prediction for July 2026: Can Buyers Finally Break the Downtrend?XRP (XRP) price trades near $1.05, caught between a year-long downtrend and a sudden burst of buying.July has historically rewarded XRP holders. This year the month arrives with on-chain accumulation
Author  Beincrypto
Jun 30, Tue
XRP (XRP) price trades near $1.05, caught between a year-long downtrend and a sudden burst of buying.July has historically rewarded XRP holders. This year the month arrives with on-chain accumulation
placeholder
Smart Money is Leaving Nvidia for This AI Chip StockNvidia stock price keeps sliding, yet the usual dip buyers are missing. Institutional money flow on the stock is the most negative of any major chip name, which means big investors are stepping back i
Author  Beincrypto
Jun 30, Tue
Nvidia stock price keeps sliding, yet the usual dip buyers are missing. Institutional money flow on the stock is the most negative of any major chip name, which means big investors are stepping back i
placeholder
XAUUSD Gold Analysis: Gold Holds Above $4,350 Ahead of US Inflation Data Is $4,500 Next? Gold holds above $4,350 following weak US jobs data. As inflation reports approach and UBS eyes $5,000, can XAUUSD break resistance at $4,435 to rally toward $4,500?
Author  Naoufal Seddik
Aug 12, Wed
Gold holds above $4,350 following weak US jobs data. As inflation reports approach and UBS eyes $5,000, can XAUUSD break resistance at $4,435 to rally toward $4,500?
placeholder
Gold Price Analysis Today: Gold Drops 1.32% Despite Lower Fed Rate-Hike Bets, Can $4,313 Support Hold? Gold fell 1.32% on August 13 after rising to $4,449.73, then reversing lower and closing near $4,349.918 below the $4,356.46 support. Softer US inflation data reduced Fed rate hike expectations, but selling pressure still dominated the session. Will $4,313 support hold?
Author  Naoufal Seddik
Aug 14, Fri
Gold fell 1.32% on August 13 after rising to $4,449.73, then reversing lower and closing near $4,349.918 below the $4,356.46 support. Softer US inflation data reduced Fed rate hike expectations, but selling pressure still dominated the session. Will $4,313 support hold?
placeholder
Gold Price Analysis Today: Gold Gains 0.94% as Markets Expect Fed to Hold Rates, Can $4,449 Resistance Break? Gold gained 0.94% on August 17, closing near $4,417.30 as softer US data strengthened expectations for unchanged Fed rates in September. Gold remains bullish, with $4,449.730 resistance and $4,310.650 support in focus.
Author  Naoufal Seddik
Aug 18, Tue
Gold gained 0.94% on August 17, closing near $4,417.30 as softer US data strengthened expectations for unchanged Fed rates in September. Gold remains bullish, with $4,449.730 resistance and $4,310.650 support in focus.
goTop
quote