


XRP (XRPUSD) Is down 1.06% on Oct 18: What Are the Risk Factors?
XRP (XRPUSD) is down 1.06% at Oct 18 04:50(ET), now at $1.2889, with a 7-day down of 8.70%.
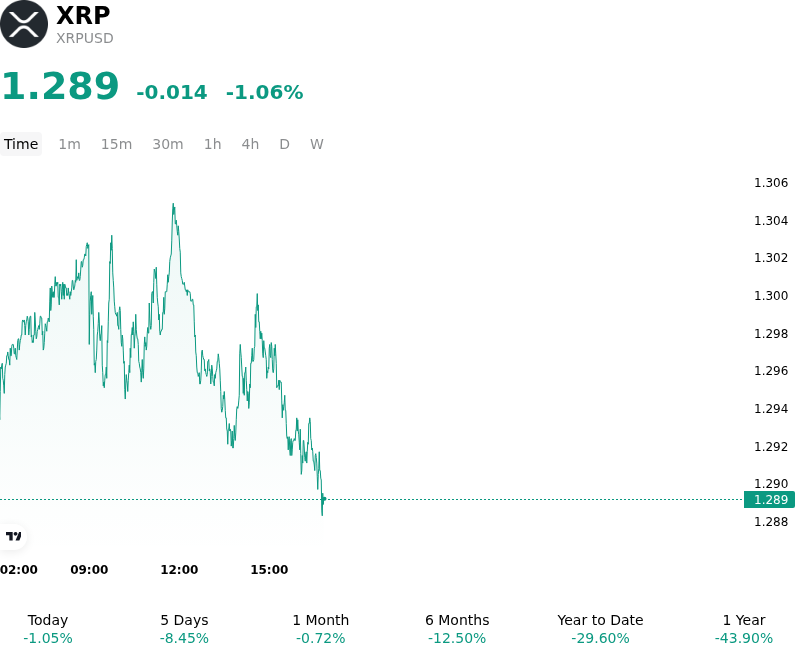
What is driving XRP (XRPUSD)’s stock price down today?
XRP experienced mild downside pressure during the trading session, primarily driven by defensive macro positioning and broader cryptocurrency market profit-taking. Elevated benchmark U.S. Treasury yields and shifting expectations surrounding impending Federal Reserve monetary policy decisions continued to exert pressure on non-yielding digital assets. This macroeconomic backdrop encouraged market participants to reduce risk exposure, triggering light long liquidations across crypto derivatives markets as open interest contracted slightly and funding rates normalized. In the absence of an immediate bullish macro catalyst, altcoins faced routine consolidation following their recent multi-week gains.
From a structural perspective, XRP encountered technical resistance near key moving averages, reinforcing a short-term range-bound pattern. Market participants also digested ongoing supply dynamics related to Ripple's planned monthly escrow releases, which generated temporary supply overhang considerations and tempered aggressive spot bidding. However, the downside was relatively contained due to persistent baseline demand from spot XRP exchange-traded funds and expanding institutional ecosystem initiatives, including corporate treasury adoption and new prime brokerage integrations.
Overall, the pullback reflects a temporary, liquidity-driven repricing session rather than a deterioration in structural fundamentals. Institutional investors continue to monitor the interaction between macro yield headwinds and institutional inflows. Key focus areas remain the implementation of native smart-contract and lending capabilities on the XRP Ledger, overall derivatives positioning, and broader global liquidity conditions to gauge whether current technical support zones will hold.
Technical Analysis of XRP (XRPUSD)
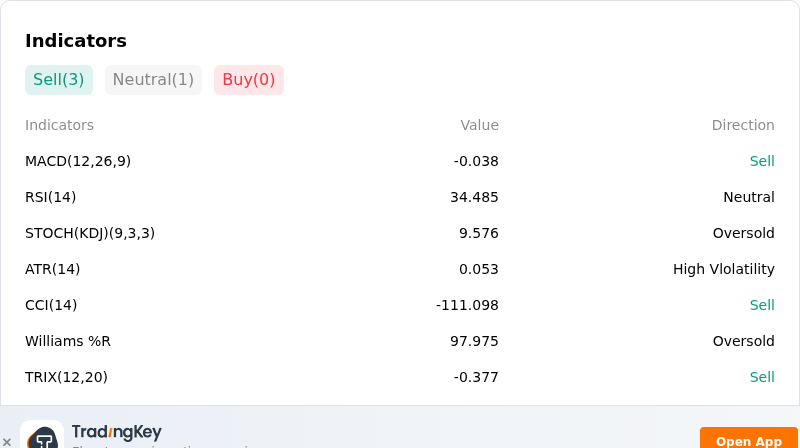
Technically, XRP (XRPUSD) shows a MACD (12,26,9) value of -0.038, indicating a sell signal. The RSI at 34.485 suggests neutral condition and the Williams %R at 97.975 suggests oversold condition. Please monitor closely.
More details about XRP (XRPUSD)
Recent Events and Risks:
- Concentrated Leveraged Long Exposure and Liquidation Cascades: Derivatives data indicates heightened structural vulnerability, with over 90% of net-long positions established above the $1.31 level and long-to-short ratios exceeding 2:1. As prices test critical support near $1.30, leveraged longs face severe margin call pressure, creating risk of a cascading liquidation unwind if key support fails.
- Elevated Whale Exchange Inflows: On-chain data reveals a seven-month high in whale-scale deposits onto centralized exchanges, driven by over 1.66 billion XRP transferred into Binance over recent rolling sessions. With exchange reserve balances accumulating more than 22 billion XRP (roughly 32% of circulating supply), traders fear potential sell-side distribution into thin bid depth.
- Spot ETF Outflows and "Sell-the-News" Momentum Unwind: Spot XRP ETFs recorded net weekly outflows, ending a multi-month period of sustained institutional inflows. The retreat is amplified by a "sell-the-news" reaction following Evernorth's Nasdaq launch, as corporate treasury holdings failed to generate immediate spot buying pressure, resulting in a sharp correction from recent peaks above $1.55 down to $1.30.
- Macro Risk Aversion and Stalled Legislative Support: Broader crypto market sentiment remains depressed following persistent U.S. inflation concerns and rising Treasury yields. This macro-driven risk-off environment is exacerbated by political delays surrounding the U.S. Senate's CLARITY Act, keeping XRP suppressed below technical resistance formed by its 50-day and 200-day moving averages.
Recommended Articles


