


Dell Technologies Inc Stock (DELL) Moved Down by 3.64% on Oct 16: Facts Behind the Movement
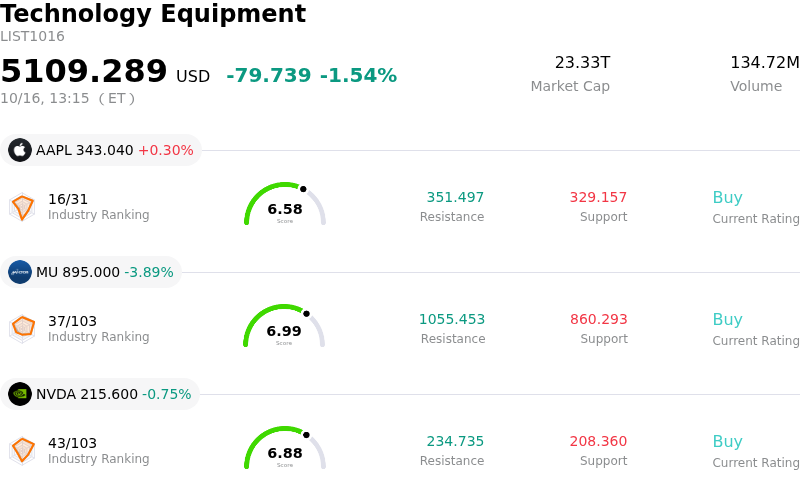
Dell Technologies Inc (DELL) moved down by 3.64%. The Technology Equipment sector is down by 1.54%. The company underperformed the industry. Top 3 stocks by turnover in the sector: Apple Inc (AAPL) up 0.30%; Micron Technology Inc (MU) down 3.89%; NVIDIA Corp (NVDA) down 0.68%.
What is driving Dell Technologies Inc (DELL)’s stock price down today?
Dell Technologies experienced persistent downward momentum as market sentiment toward the enterprise hardware provider adjusted following a high-profile analyst downgrade earlier in the week. Barclays downgraded the stock from Overweight to Equal Weight, cutting its price target and triggering a re-evaluation across the artificial intelligence hardware sector. The downgrade raised concerns that the rapid expansion in AI server demand may face near-term deceleration. Analysts emphasized that a significant portion of recent enterprise hardware revenue gains stemmed from higher memory component costs passed along to end customers rather than a structural inflection in broad enterprise AI adoption, stoking fears over potential margin compression as memory prices normalize.
Adding to the stock's downside pressure, broader macroeconomic headwinds—specifically persistent inflation readings—have stirred concerns regarding elevated borrowing costs for data center operators and enterprise IT purchasers. Because AI-optimized server builds carry narrower operating margins compared to traditional enterprise storage and server architectures, institutional investors are scrutinizing whether surging top-line revenue can efficiently translate into expanded earnings power. Furthermore, recent regulatory disclosures showing notable insider share sales near multi-month highs reinforced a wave of institutional profit-taking following the stock's dramatic rally over the past year.
Despite the recent market pullbacks, Dell retains strong operational footing within its Infrastructure Solutions Group, anchored by a massive backlog of undelivered AI-optimized server orders and robust revenue momentum. Corporate management maintains an optimistic long-term outlook, highlighting that structural demand for high-performance computing infrastructure continues to outpace semiconductor supply capacity. Nevertheless, short-term price action remains governed by investor risk aversion, as Wall Street demands greater clarity on enterprise adoption timelines, margin sustainability, and valuation alignment before establishing new exposure.
Technical Analysis of Dell Technologies Inc (DELL)
Technically, Dell Technologies Inc (DELL) shows a MACD (12,26,9) value of -28.550, indicating a neutral signal. The RSI at 33.936 suggests neutral condition and the Williams %R at 96.035 suggests oversold condition. Please monitor closely.
Media Coverage of Dell Technologies Inc (DELL)
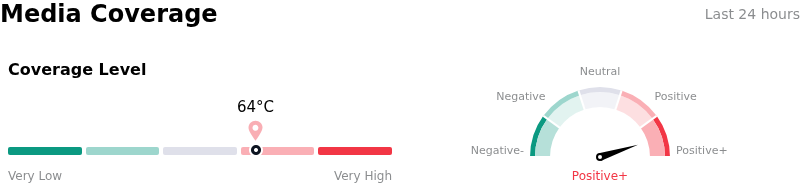
In terms of media coverage, Dell Technologies Inc (DELL) shows a coverage score of 64, indicating a high level of media attention. The overall market sentiment index is currently in extremely bullish zone.
Fundamental Analysis of Dell Technologies Inc (DELL)
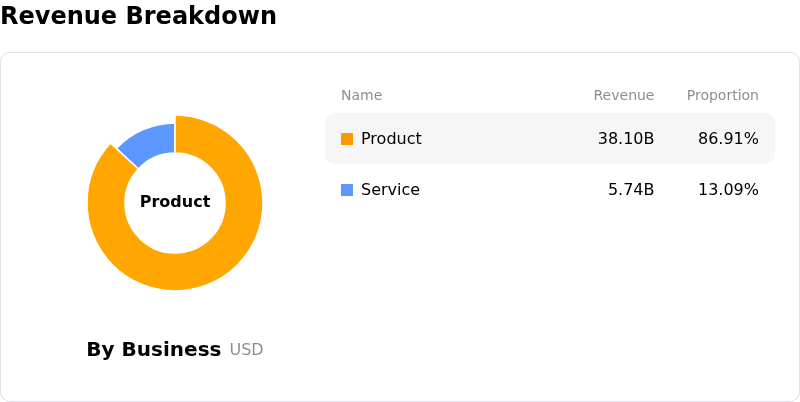
Dell Technologies Inc (DELL) is in the Technology Equipment industry. Its latest annual revenue is $113.54B, ranking 2 in the industry. The net profit is $5.94B, ranking 4 in the industry. Company Profile
Over the past month, multiple analysts have rated the company as Buy, with an average price target of $585.20, a high of $700.00, and a low of $480.00.
More details about Dell Technologies Inc (DELL)
Company Specific Risks:
- Barclays Downgrade and Valuation Compression: Barclays downgraded Dell Technologies from Overweight to Equal-Weight and reduced its price target to $574, warning that the stock's massive year-to-date rally has stretched valuations while broad enterprise spending has yet to show meaningful upside from artificial intelligence adoption.
- Memory-Driven Pricing Power Normalization: Analysts emphasized that recent server and storage top-line growth was primarily propelled by passing through higher memory component costs into elevated average selling prices rather than robust organic unit volume growth, leaving revenues and operating margins vulnerable as component prices normalize.
- Heavy Insider Equity Liquidation: Significant share sales by Silver Lake-affiliated entities near peak price levels of $595.51 created market supply overhang, amplifying intraday volatility and signaling cautious capital allocation from major institutional sponsors.
- Macro Rate Sensitivities and Enterprise Budget Strain: Accelerating capital expenditure requirements for AI infrastructure, compounded by higher borrowing costs following recent hot inflation readings, threaten to tighten enterprise hardware spending while increasing interest burdens following Dell's $5 billion debt issuance.
Recommended Articles


