


Brent Futures (UKOIL-F) Is down by 2.09% on Oct 15: Is the Demand Outlook Changing?
Brent Futures (UKOIL-F) is down 2.09% at Oct 15 03:30(ET), now at $103.81, with a 7-day down of 0.06%.
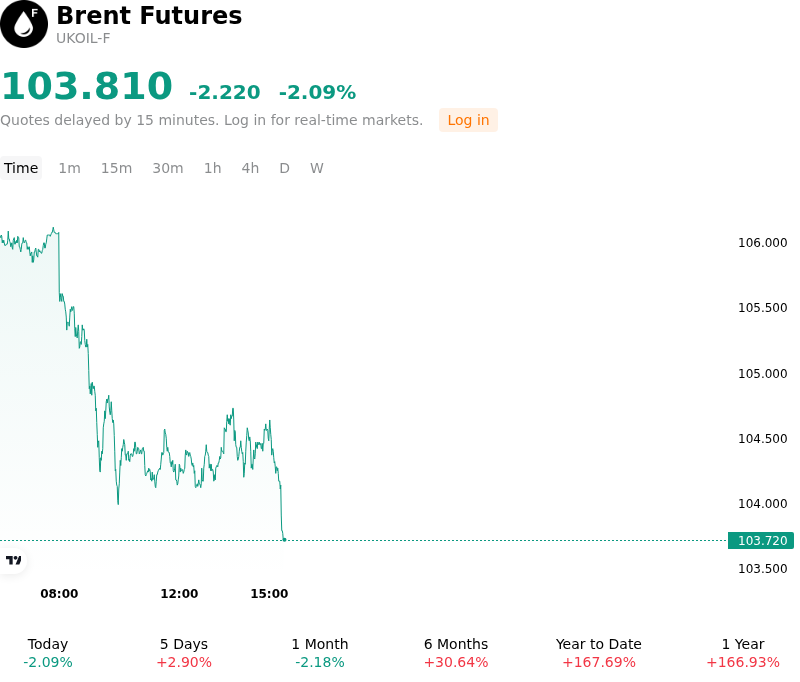
What is driving Brent Futures (UKOIL-F)’s stock price down today?
Easing supply disruption premiums combined with downward revisions to global oil demand forecasts weighed heavily on Brent crude futures during the trading session. Physical supply availability has normalized faster than market participants previously priced in, driven by a steady rebound in Middle Eastern export volumes and a reduction in operational shut-ins. Concurrently, energy forecasting agencies lowered global consumption estimates for the second half of the year, highlighting mounting evidence of demand destruction in major importing regions and weak industrial consumption.
Macroeconomic and monetary headwinds further magnified the downward pressure on energy prices. Persistent expectations of prolonged restrictive central bank monetary policy continue to weigh on global economic expansion, reinforcing concerns regarding sluggish manufacturing PMIs and subdued freight activity. In parallel, strength in the US dollar rendered dollar-denominated crude benchmark contracts more expensive for foreign buyers, triggering systematic profit-taking and unwinding of long speculative positions by institutional managers.
Looking at the broader structural market balance, market sentiment is increasingly anchored by expectations of an expanding supply surplus moving into subsequent quarters. While middle distillate inventories remain historically constrained ahead of seasonal refinery maintenance, rising non-OPEC+ output and the projected return of shut-in capacity are expected to facilitate stock replenishment. Consequently, geopolitical risk premiums continue to erode, leaving prices increasingly vulnerable to macroeconomic demand headwinds until clear evidence of tighter physical balances re-emerges.
Technical Analysis of Brent Futures (UKOIL-F)
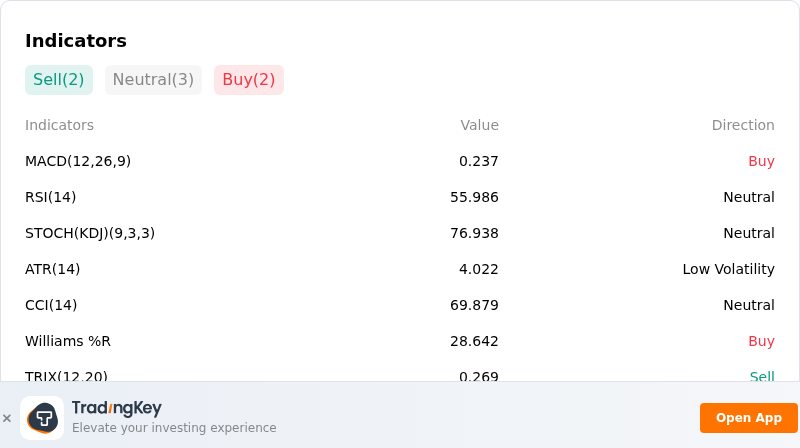
Technically, Brent Futures (UKOIL-F) shows a MACD (12,26,9) value of 0.237, indicating a buy signal. The RSI at 55.986 suggests neutral condition and the Williams %R at 28.642 suggests buy condition. Please monitor closely.
More details about Brent Futures (UKOIL-F)
Recent Events and Risks:
- U.S. Policy Shifts on Shadow Fleet Sanctions: Brent crude futures experienced downside pressure following reports that U.S. officials are considering easing sanctions on shadow-fleet oil tankers from Russia, Iran, and Venezuela, a regulatory move designed to lower global shipping costs and expand usable tanker capacity.
- OPEC+ Supply Restorations and Production Gains: Physical supply recovery is exerting downward drag on prices, as recent secondary source reports showed OPEC+ crude output surged by 900,000 barrels per day in September—led by increased Saudi Arabian production—alongside the near-full restoration of U.S. Gulf of Mexico offshore output.
- Drastic Downgrades to 2026 Global Demand Forecasts: Institutional market sentiment has been dampened by OPEC significantly cutting its 2026 global oil demand growth projection down to 180,000–400,000 barrels per day, highlighting persistent consumption weakness across developed OECD economies.
- Erosion of Geopolitical Risk Premiums: Intraday price pullbacks reflect positioning unwinds as ongoing diplomatic de-escalation talks and proposed transit agreements threaten to swiftly dismantle the geopolitical risk premium embedded in Brent crude contracts.
Recommended Articles


