


Natural Gas (NATGAS) Is up 2.25% on Oct 13: Key Drivers to Watch
Natural Gas (NATGAS) is up 2.25% at Oct 13 09:25(ET), now at $3.447, with a 7-day up of 6.69%.
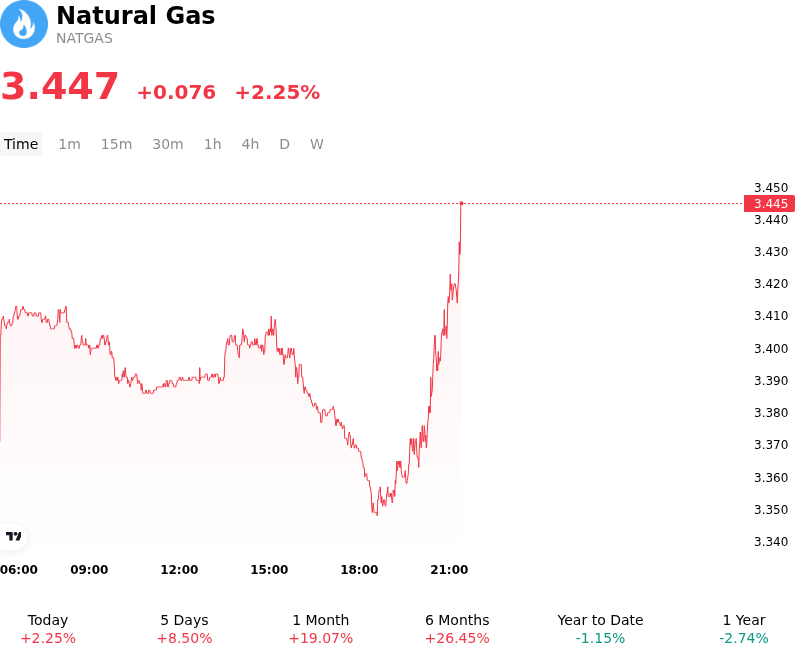
What is driving Natural Gas (NATGAS)’s stock price up today?
Natural gas prices advanced as updated weather models introduced cooler temperature forecasts across key northern heating regions, signaling an early uptick in heating degree days as the shoulder season transitions toward winter. The prospective rise in residential and commercial space-heating demand provided fundamental support, encouraging market participants to re-evaluate near-term consumption trajectories.
On the supply side, lower-than-average seasonal storage injection estimates contributed to tighter market balance expectations. While overall inventory levels remain adequately supplied heading into the heating season, recent weekly storage builds have lagged historical norms due to steady domestic power burn and sustained demand from liquefied natural gas export facilities. High feedgas volumes into major export terminals continue to lock in an elevated floor for structural demand, reinforcing the linkage between domestic balances and global gas benchmarks.
International market dynamics also provided a supportive tailwind. Rising wholesale gas prices across Europe and Asia, driven by geopolitical risks around key maritime trade corridors and below-average European storage accumulation, have preserved strong profit margins for export cargoes. This global price strength ensures that domestic liquefaction infrastructure operates near maximum operational capacity, preventing surplus gas from accumulating entirely within domestic underground storage.
From a positioning perspective, the upward price action was amplified by institutional short-covering following recent market consolidation. As futures cleared short-term technical resistance levels, trend-following strategies and macro funds adjusted exposure, adding liquidity-driven momentum to the advance.
Looking forward, institutional investors continue to monitor evolving late-autumn weather outlooks, production trends across key domestic shale basins, and weekly inventory reports to gauge whether current price strength marks the beginning of a sustained winter repricing cycle or a temporary weather-driven adjustment.
Technical Analysis of Natural Gas (NATGAS)
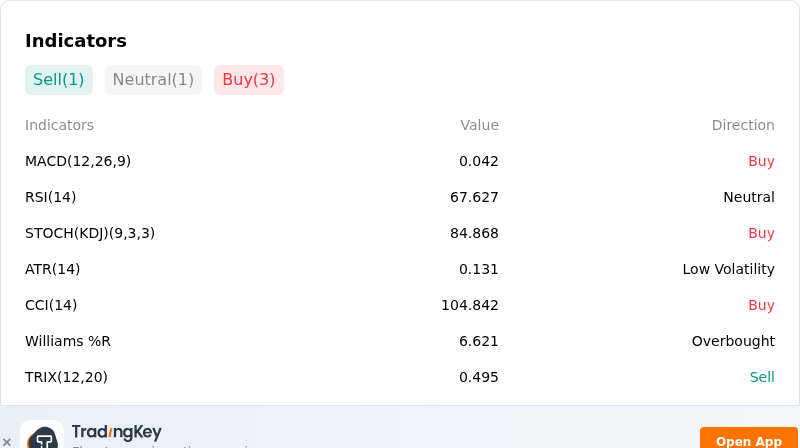
Technically, Natural Gas (NATGAS) shows a MACD (12,26,9) value of 0.042, indicating a buy signal. The RSI at 67.627 suggests neutral condition and the Williams %R at 6.621 suggests overbought condition. Please monitor closely.
More details about Natural Gas (NATGAS)
Recent Events and Risks:
- Unseasonably Mild Autumn Weather: Updated meteorological forecasts project persistent above-average temperatures across major U.S. consuming regions into late October, delaying seasonal heating demand and triggering long liquidation in prompt-month futures contracts.
- Rapid Supply Recovery and Pipeline Egress Expansion: Gulf Coast dry gas output is swiftly returning to pre-storm levels, while expanding Permian Basin pipeline takeaway capacity and resilient Lower-48 production continue to add domestic supply ahead of new LNG export demand.
- Elevated Storage Surplus Buffer: Underground natural gas inventories remain comfortably above the five-year seasonal average as the injection season nears its end, providing an ample supply cushion that caps weather-driven price rallies.
- Regional Spot Weakness and Demand Destruction: Severely depressed cash prices in regional producing hubs, combined with localized pipeline bottlenecks and lingering power-outage demand losses from recent Gulf storms, exert continuous downward pressure on near-term pricing.
Recommended Articles


