


US Cocoa Futures (COCOA-F) Moved Sharply on Oct 13: Inventories, the Dollar, or Geopolitics?
US Cocoa Futures (COCOA-F) is up 2.23% at Oct 13 05:15(ET), now at $5789.5, with a 7-day up of 0.54%.
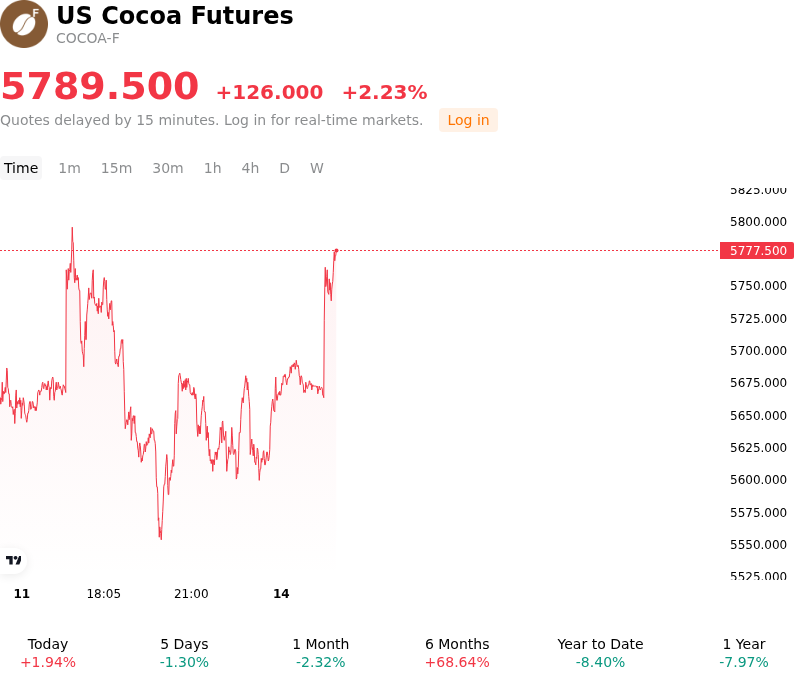
What is driving US Cocoa Futures (COCOA-F)’s stock price up today?
The upward movement in cocoa futures was primarily driven by renewed supply concerns and near-term logistical bottlenecks across West Africa as the 2026/27 main crop harvest gets underway. In key producing regions, particularly Ivory Coast, heavy rainfall damaged rural road infrastructure, delaying bean collection and slowing transportation to export port terminals. These immediate transport delays have constrained near-term deliverable availability, prompting market participants to re-introduce a premium on spot and prompt supplies.
Beyond short-term logistical delays, bullish sentiment was reinforced by deteriorating yield expectations for the 2026/27 crop season. Field surveys across Ivory Coast and Ghana continue to highlight structural production challenges, including lower pod counts, below-average cherelle formation, aging plantations, and elevated incidence of black pod disease resulting from prolonged cloud cover and excessive moisture. Initial production forecasts for top-grower Ivory Coast project a double-digit percentage decline in main-crop output, with neighboring Ghana facing similar yield contractions. Additionally, emerging projections of a strengthening El Niño pattern threaten rainfall deficits through early 2027, heightening concerns over mid-to-long-term crop development.
Commercial friction in regional supply chains has further complicated the outlook. A notable divergence in farmgate pricing policies between Ivory Coast and Ghana raised fears of informal cross-border trade shifts, creating origination uncertainty for international merchants and chocolate manufacturers. While elevated exchange warehouse stocks and lingering consumer price sensitivity present medium-term headwinds to grinding demand, immediate physical tightness and climate-driven yield risks remain the primary catalysts shaping current price dynamics.
Technical Analysis of US Cocoa Futures (COCOA-F)
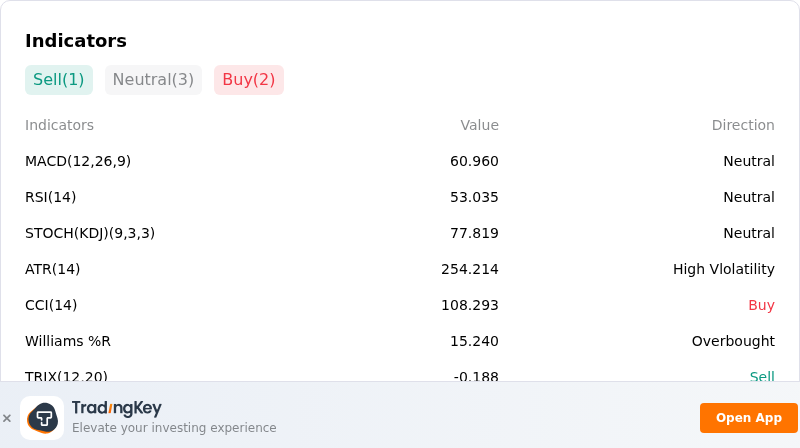
Technically, US Cocoa Futures (COCOA-F) shows a MACD (12,26,9) value of 60.960, indicating a neutral signal. The RSI at 53.035 suggests neutral condition and the Williams %R at 15.240 suggests overbought condition. Please monitor closely.
More details about US Cocoa Futures (COCOA-F)
Recent Events and Risks:
- ICE Inventory Expansion: Certified exchange-monitored cocoa inventories have climbed to a 2.25-year high of over 3.55 million bags, signaling ample near-term port stocks and placing persistent downside pressure on front-month contract pricing.
- Downstream Demand Destruction: Industrial processors and confectionary manufacturers are facing severe margin squeezes, underscored by major processor Cargill reporting quarterly mark-to-market losses and Lindt & Sprüngli cutting sales growth guidance due to subdued consumer sentiment.
- Strong Near-Term Port Deliveries: Cumulative cocoa shipments to Ivorian ports surged nearly 20% year-over-year to 2.18 million metric tons following a 30% increase in full-year harvested output, expanding spot supply and dampening short-term deficit concerns.
- Macro Currency and Liquidation Risk: Broad strength in the US Dollar Index ($DXY) to multi-month highs, combined with technical consolidation below key moving average resistance levels, elevates the risk of automated selling and long positioning unwinds.
Recommended Articles


